Get Started with Intel® VTune™ Profiler for macOS*
Use VTune Profiler on a macOS system to perform remote target analysis on a non-macOS system (Linux* or Android* only) .
You cannot use VTune Profiler in a macOS environment for these purposes:
- Profile the macOS system on which it is installed.
- Collect data on a remote macOS system.
To analyze performance of a remote Linux* or Android* target from the macOS host, do one of these steps:
Run a VTune Profiler analysis on the macOS system with a remote system specified as the target. When analysis begins, VTune Profiler connects to the remote system to collect data, then brings the results back to the macOS host for viewing.
Run an analysis on the target system locally and copy the results to a macOS system for viewing in VTune Profiler.
The steps in this document assume a remote Linux target system and collect performance data using SSH access from VTune Profiler on a macOS host system.
Before You Begin
Build your Linux application with symbol information and in Release mode with all optimizations enabled. For detailed information, see the compiler settings in the VTune Profiler help.
Set up SSH access from the host macOS system to the target Linux system to work in the password-less mode.
Step 1: Start VTune Profiler
Launch VTune Profiler with the vtune-gui command.
By default, the <install_dir> is /opt/intel/oneapi/.
When the GUI opens, click
 in the Welcome screen.
 In the Create Project dialog box, specify the project name and location.
Click Create Project.
Step 2: Configure and Run Analysis
After you create a new project, the Configure Analysis window opens with the Performance Snapshot analysis type. This analysis presents an overview of issues that affect the performance of your application on the target system.
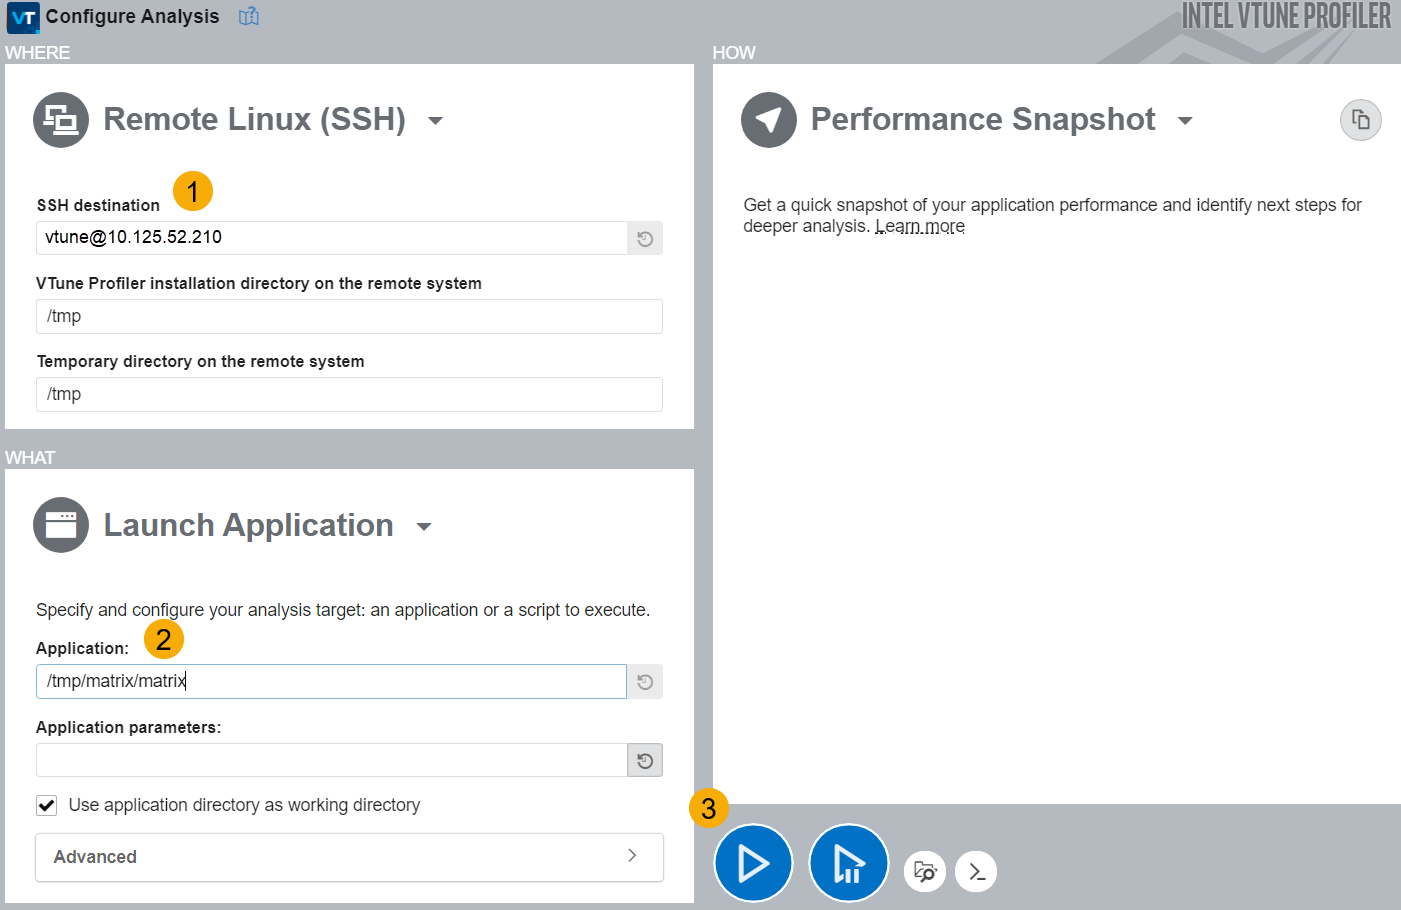
In the WHERE pane, select Remote Linux (SSH) and specify the target Linux system using username@hostname[:port].
VTune Profiler connects to the Linux system and installs the target package.
In the WHAT pane, provide the path to your application on the target Linux system.
Click the Start button to run Performance Snapshot on the application.
Step 3: View and Analyze Performance Data
When data collection completes, VTune Profiler displays analysis results on the macOS system. Start your analysis in the Summary window. Here, you see a performance overview of your application.
The overview typically includes several metrics along with their descriptions.
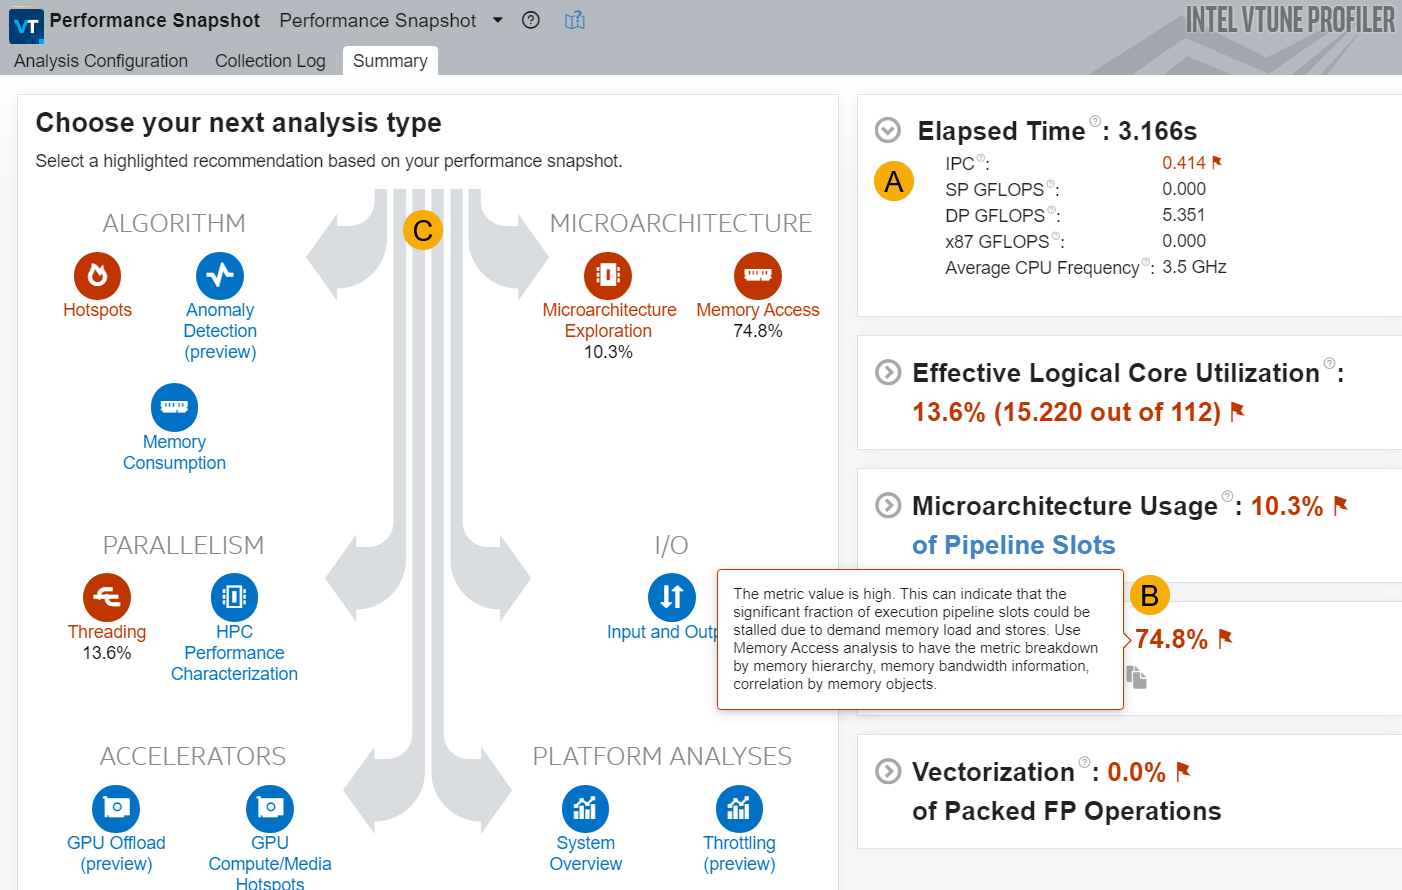
Expand each metric for detailed information about contributing factors. |
|
A flagged metric indicates a value outside acceptable/normal operating range. Use tool tips to understand how to improve a flagged metric. |
|
See guidance on other analyses you should consider running next. The Analysis Tree highlights these recommendations. |
Next Steps
Performance Snapshot is a good starting point to get an overall assessment of application performance with VTune Profiler. Next, check if your algorithm requires tuning.
Run Hotspots Analysis on your application.
Follow a Hotspots tutorial. Learn techniques to get the most out of your Hotspots analysis.
- Once your algorithm is well-tuned, run Performance Snapshot again to calibrate results and identify potential performance improvements in other areas.