Profiling Machine Learning Applications (NEW)
Learn how to use Intel® VTune™ Profiler to profile Machine Learning (ML) workloads.
In our increasingly digital world powered by software and web-based applications, Machine Learning (ML) applications have become extremely popular. The ML community uses several Deep Learning (DL) frameworks like Tensorflow*, PyTorch*, and Keras* to solve real world problems.
However, understanding computational and memory bottlenecks in DL code like Python or C++ is challenging and often requires significant effort due to the presence of hierarchical layers and non-linear functions. Frameworks like Tensorflow* and PyTorch* provide native tools and APIs that enable the collection and analysis of performance metrics during different stages of Deep Learning Model development. But the scope of these profiling APIs and tools is quite limited. They do not provide deep insight at the hardware level to help you optimize different operators and functions in the Deep Learning models.
In this recipe, learn how you can use VTune Profiler to profile a Python workload and improve data collection with additional APIs.
Content expert: Rupak Roy
Ingredients
Here are the hardware and software tools you need for this recipe.
Application: This recipe uses the TensorFlow_HelloWorld.py and Intel_Extension_For_PyTorch_Hello_World.py applications. Both of these code samples are implementations of a simple neural network with a convolution layer, a normalization layer, and a ReLU layer which can be trained and evaluated.
Analysis Tool: User-mode sampling and tracing collection with VTune Profiler (version 2022 or newer)
NOTE:Starting with the 2020 release, Intel® VTune™ Amplifier has been renamed to Intel® VTune™ Profiler.
Most recipes in the Intel® VTune™ Profiler Performance Analysis Cookbook are flexible. You can apply them to different versions of Intel® VTune™ Profiler. In some cases, minor adjustments may be required.
Get the latest version of Intel® VTune™ Profiler:
From the Intel® VTune™ Profiler product page.
Download the latest standalone package from the Intel® oneAPI standalone components page.
CPU: 11th Gen Intel® Core(TM) i7-1165G7 @ 2.80GHz
Operating System: Ubuntu Server 20.04.5 LTS
Run VTune Profiler on a Python Application
Let us start by running a Hotspots analysis on the Intel_Extension_For_PyTorch_Hello_World.py ML application, without any change to the code. This analysis is a good starting point to identify the most time-consuming regions in the code.
In the command line, type:
vtune -collect hotspots -knob sampling-mode=sw -knob enable-stack-collection=true -source-search-dir=path_to_src -search-dir /usr/bin/python3 -result-dir vtune_hotspots_results -- python3 Intel_Extension_For_PyTorch_Hello_World.py
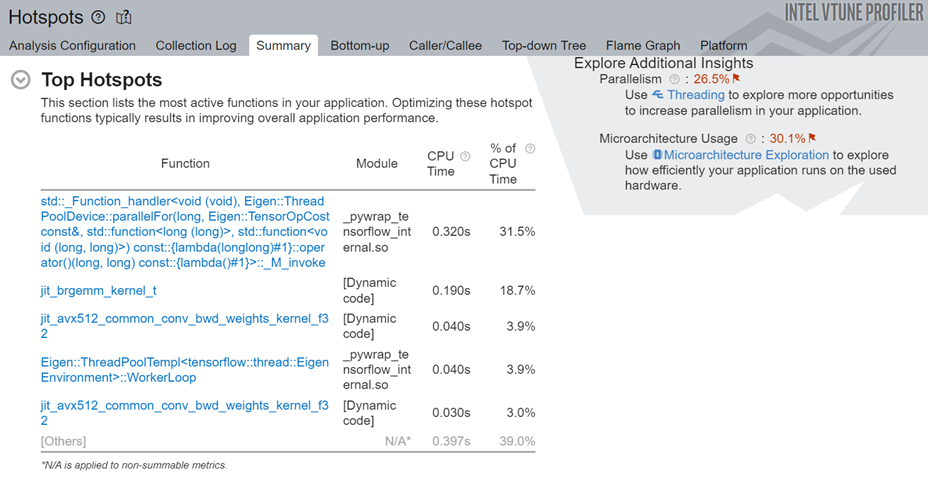
Once the analysis completes, see the most active functions in the code by examining the Top Hotspots section in the Summary window.
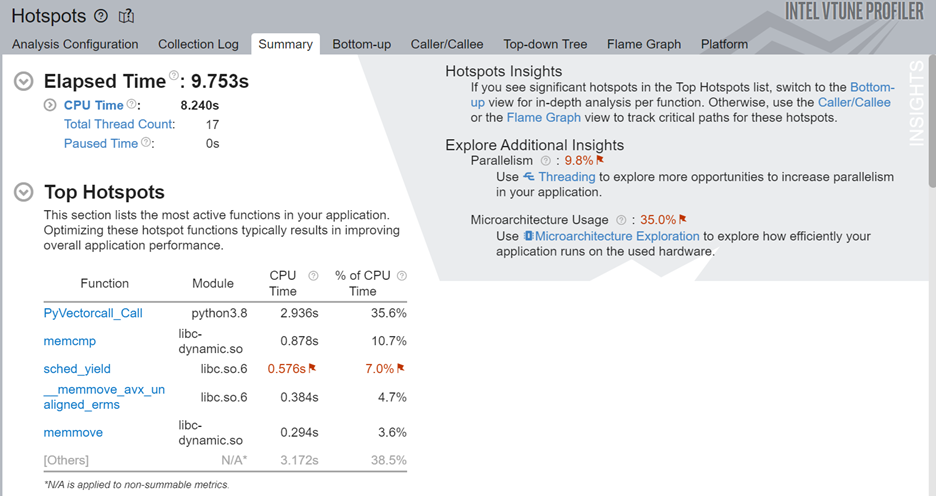
In this case, we see that the sched_yield function consumes considerable CPU time. Excessive calls to this function can cause unnecessary context switches and result in a degradation of application performance.
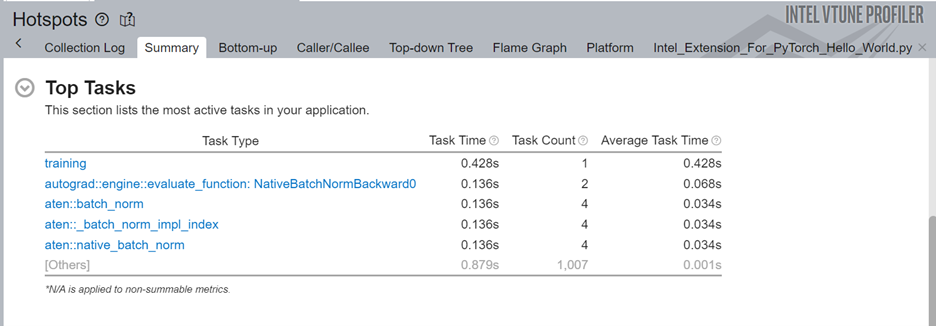
Next, let us look at the top tasks in the application:
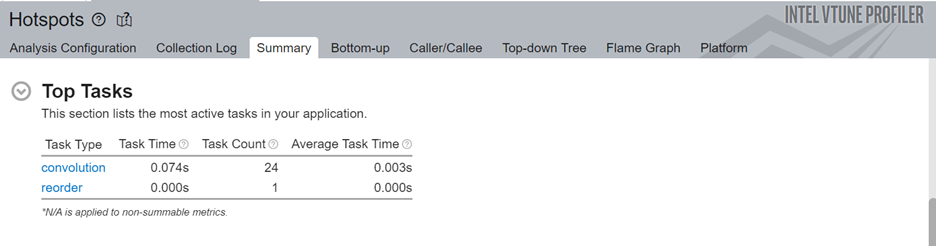
Here we can see that the convolution task consumes the most processing time for this code.
While you can dig deeper by switching to the Bottom-up window, it may be challenging to isolate the most interesting regions for optimization. This is particularly true for larger applications because there may be a lot of model operators and functions in every layer of the code. Therefore, we will now add Intel® Instrumentation and Tracing Technology (ITT) APIs to generate results that are easier to interpret.
Include ITT-Python APIs
Let us now add Python* bindings available in ITT-Python to the Intel® Instrumentation and Tracing Technology (ITT) APIs used by VTune Profiler. These bindings include user task labels to control data collection and some user task APIs (that can create and destroy task instances).
ITT-Python uses three types of APIs:
- Domain APIs
- domain_create(name)
- Task APIs
- task_begin(domain, name)
- task_end(domain)
- Anomaly Detection APIs
- itt_pt_region_create(name)
- itt_pt_region_begin(region)
- itt_pt_region_end(region)
The following example from TensorFlow_HelloWorld.py calls the Domain and Task APIs in ITT-Python:
itt.resume()
domain = itt.domain_create("Example.Domain.Global")
itt.task_begin(domain, "CreateTrainer")
for epoch in range(0, EPOCHNUM):
  for step in range(0, BS_TRAIN):
    x_batch = x_data[step*N:(step+1)*N, :, :, :]
    y_batch = y_data[step*N:(step+1)*N, :, :, :]
    s.run(train, feed_dict={x: x_batch, y: y_batch})
    '''Compute and print loss. We pass Tensors containing the predicted and    true values of y, and the loss function returns a Tensor containing the loss.'''
    print(epoch, s.run(loss,feed_dict={x: x_batch, y: y_batch}))
itt.task_end(domain)
itt.pause()
Here is the sequence of operations:
- Use itt.resume() API to resume the profiling just before the loop begins to execute.
- Create an ITT domain (like Example.Domain.Global) for a majority of the ITT API calls.
- Use the itt.task.begin() API to start the task. Label the task as CreateTrainer. This label appears in profiling results.
- Use itt.task() API to end the task.
- Use itt.pause() API to pause data collection.
Run Hotspots and Microarchitecture Exploration Analyses
Once you have modified your code, run the Hotspots analysis on the modified code.
vtune -collect hotspots -start-paused -knob enable-stack-collection=true -knob sampling-mode=sw -search-dir=/usr/bin/python3 -source-search-dir=path_to_src -result-dir vtune_data -- python3 TensorFlow_HelloWorld.py
This command uses the -start-paused parameter to profile only those code regions marked by ITT-Python APIs. Let us look at the results of the new Hotspots analysis. The Top Hotspots section displays hotspots in the code regions marked by ITT-Python APIs.
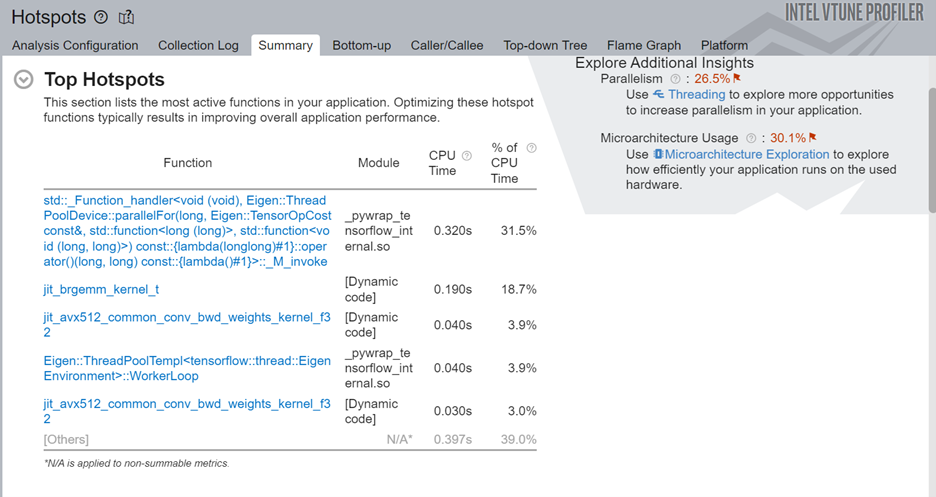
Examine the most time-consuming ML primitives in the target code region. Focus on these primitives first to improve optimization. Using the ITT-APIs helps you identify those hotspots quickly which are more pertinent to ML primitives.
Next, look at the top tasks targeted by the ITT-Python APIs. Since you can use these APIs to limit profiling results to specific code regions, the ITT logical tasks in this section display information including:
- CPU time
- Effective time
- Spin time
- Overhead time
- CPU utilization time
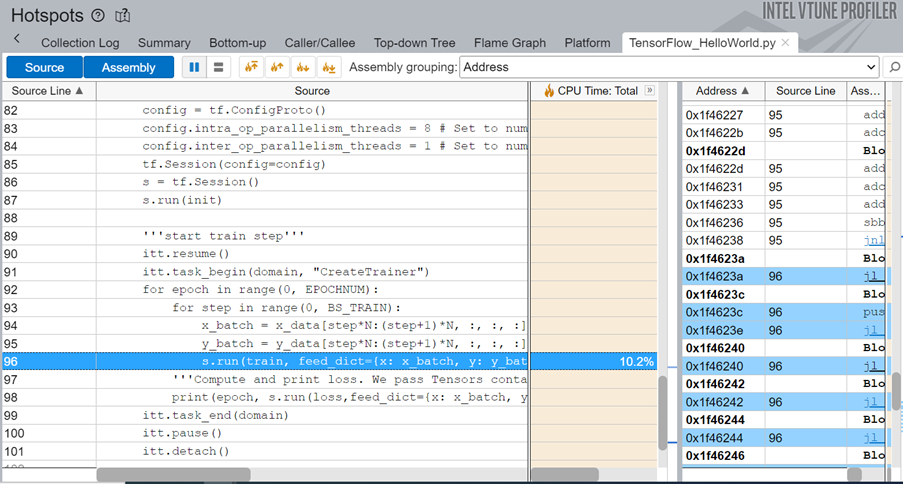
- Source code line level analysis

The source line level profiling of the ML code reveals the source line breakdown of CPU time. In this example, the code spends 10.2% of the total execution time to train the model.
To obtain a deeper understanding of application performance, let us now run the Microarchitecture Exploration analysis. In the command window, type:
vtune -collect uarch-exploration -knob collect-memory-bandwidth=true -source-search-dir=path_to_src -search-dir /usr/bin/python3 -result-dir vtune_data_tf_uarch -- python3 TensorFlow_HelloWorld.py
Once the analysis completes, the Bottom-up window displays detailed profiling information for the tasks marked with ITT-Python APIs. We can see that the CreateTrainer task is front-end bound, which means that the front end is not supplying enough operations to the back end. Also, there is a high percentage of heavy-weight operations (those which need more than 2 µops).
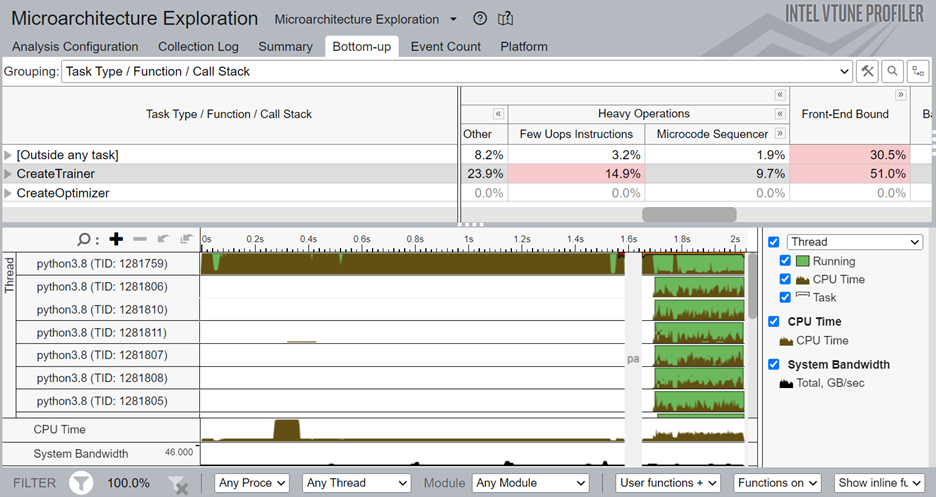
To focus your analysis on a smaller block of code, right click on one of the CreateTrainer tasks and enable filtering.
Add PyTorch* ITT APIs (for PyTorch Framework only)
Just like ITT-Python APIs, you can also use PyTorch* ITT APIs with VTune Profiler. Use PyTorch ITT APIs to label the time span of individual PyTorch operators and get detailed analysis results for customized code regions. PyTorch 1.13 provides these versions of torch.profiler.itt APIs for use with VTune Profiler:
- is_available()
- mark(msg)
- range_push(msg)
- range_pop()
Let us see how these APIs are used in a code snippet from Intel_Extension_For_PyTorch_Hello_World.py.
itt.resume()
with torch.autograd.profiler.emit_itt():
        torch.profiler.itt.range_push('training')
        model.train()
        for batch_index, (data, y_ans) in enumerate(trainLoader):
            data = data.to(memory_format=torch.channels_last)
            optim.zero_grad()
            y = model(data)
            loss = crite(y, y_ans)
            loss.backward()
            optim.step()
        torch.profiler.itt.range_pop()
itt.pause()
The above example features this sequence of operations:
- Use the itt.resume() API to resume the profiling just before the loop begins to execute.
- Use the torch.autograd.profiler.emit_itt() API for a specific code region to be profiled.
- Use the range_push() API to push a range onto a stack of nested range spans. Mark it with a message ('training').
- Insert the code region of interest.
- Use the range_pop() API to pop a range from the stack of nested range spans.
Run Hotspots Analysis with PyTorch ITT APIs
Let us now run the Hotspots analysis for the code modified with PyTorch ITT APIs. In the command window, type:
vtune -collect hotspots -start-paused -knob enable-stack-collection=true -knob sampling-mode=sw -search-dir=/usr/bin/python3 -source-search-dir=path_to_src -result-dir vtune_data_torch_profiler_comb -- python3 Intel_Extension_For_PyTorch_Hello_World.py
Here are the top hotspots in our code region of interest:
In the Top Tasks section of the Summary, we see the training task which was labeled using the ITT-API.
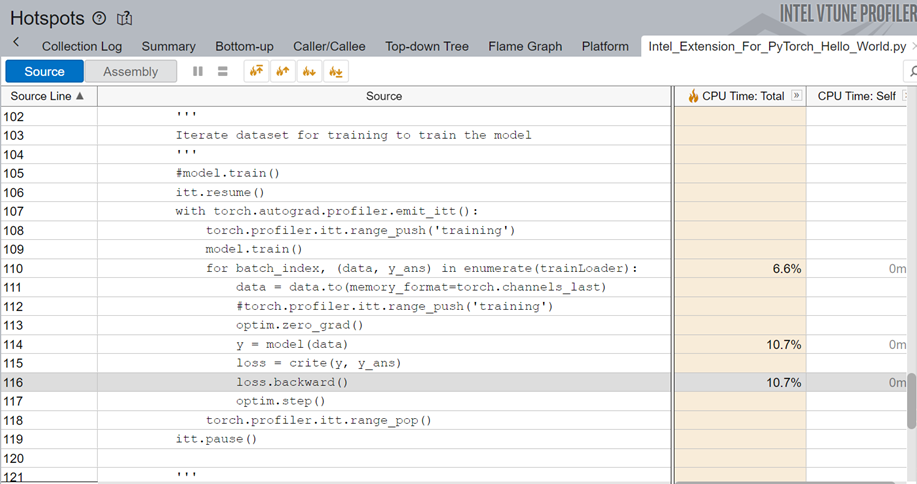
When we examine the source line profiling of the PyTorch code, we see that the code spends 10.7% of the total execution time in backpropagation.
Switch to the Platform window to see the timeline for the training task, which was marked using PyTorch ITT APIs.
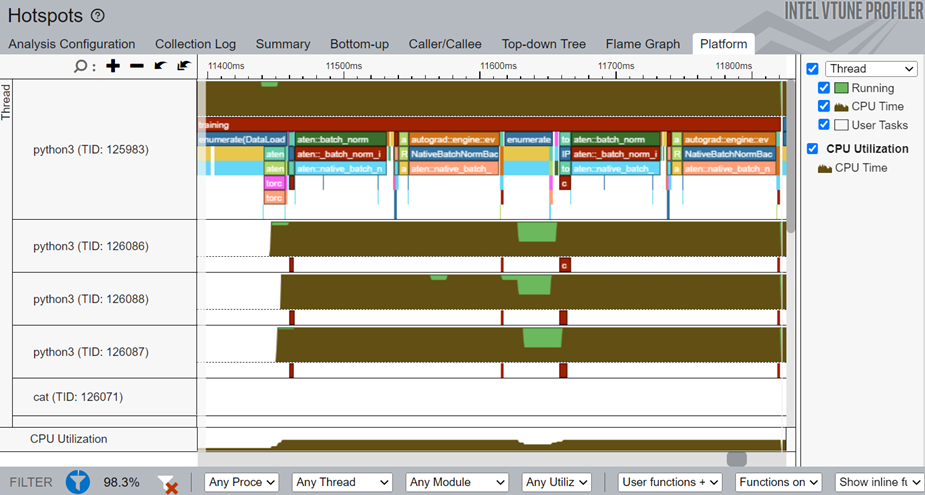
In the timeline, the main thread is python3(TID:125983) and it contains several smaller threads. Operator names that start with aten::batch_norm, aten::native_batch_norm, aten::batch_norm_i are model operators.
From the Platform window, you can glean these details:
- CPU usage (for a specific time period) for every individual thread
- Start time
- Duration of user tasks and oneDNN primitives(Convolution, Reorder)
- Source lines for each task and primitive. Once the source file for a task/primitive is compiled with debug information, click on the task/primitive to see the source lines.
- Profiling results grouped by iteration number (when multiple iterations are available)