1. Before You Begin
2. Introduction
3. Functional Description
4. Interface Overview
5. Parameters (H-Tile)
6. Parameters (P-Tile) (F-Tile) (R-Tile)
7. Designing with the IP Core
8. Software Programming Model
9. Registers
10. Troubleshooting/Debugging
11. Multi Channel DMA FPGA IP for PCI Express User Guide Archives
12. Revision History for the Multi Channel DMA FPGA IP for PCI Express User Guide
3.1. Multi Channel DMA
3.2. Bursting Avalon-MM Master (BAM)
3.3. Bursting Avalon-MM Slave (BAS)
3.4. MSI Interrupt
3.5. Config Slave (CS)
3.6. Root Port Address Translation Table Enablement
3.7. Hard IP Reconfiguration Interface
3.8. Config TL Interface
3.9. Configuration Intercept Interface (EP Only)
3.10. Data Mover Only
4.1. Port List
4.2. Clocks
4.3. Resets
4.4. Multi Channel DMA
4.5. Bursting Avalon-MM Master (BAM) Interface
4.6. Bursting Avalon-MM Slave (BAS) Interface
4.7. Legacy Interrupt Interface
4.8. Hot Plug Interface (RP only)
4.9. MSI Interface
4.10. Config Slave Interface (RP only)
4.11. Hard IP Reconfiguration Interface
4.12. Config TL Interface
4.13. Configuration Intercept Interface (EP Only)
4.14. Data Mover Interface
4.15. Hard IP Status Interface
4.16. Precision Time Management (PTM) Interface
8.1.6.1. ifc_api_start
8.1.6.2. ifc_mcdma_port_by_name
8.1.6.3. ifc_qdma_device_get
8.1.6.4. ifc_num_channels_get
8.1.6.5. ifc_qdma_channel_get
8.1.6.6. ifc_qdma_acquire_channels
8.1.6.7. ifc_qdma_release_all_channels
8.1.6.8. ifc_qdma_device_put
8.1.6.9. ifc_qdma_channel_put
8.1.6.10. ifc_qdma_completion_poll
8.1.6.11. ifc_qdma_request_start
8.1.6.12. ifc_qdma_request_prepare
8.1.6.13. ifc_qdma_descq_queue_batch_load
8.1.6.14. ifc_qdma_request_submit
8.1.6.15. ifc_qdma_pio_read32
8.1.6.16. ifc_qdma_pio_write32
8.1.6.17. ifc_qdma_pio_read64
8.1.6.18. ifc_qdma_pio_write64
8.1.6.19. ifc_qdma_pio_read128
8.1.6.20. ifc_qdma_pio_write128
8.1.6.21. ifc_qdma_pio_read256
8.1.6.22. ifc_qdma_pio_write256
8.1.6.23. ifc_request_malloc
8.1.6.24. ifc_request_free
8.1.6.25. ifc_app_stop
8.1.6.26. ifc_qdma_poll_init
8.1.6.27. ifc_qdma_poll_add
8.1.6.28. ifc_qdma_poll_wait
8.1.6.29. ifc_mcdma_port_by_name
10.1.3. Launching the Debug Toolkit
Use the design example you compiled by following the Quick Start Guide to familiarize yourself with the Debug Toolkit. Follow the steps in the Generating the Design Example and Compiling the Design Example to generate the SRAM Object File, (.sof) for this design example.
To use the Debug Toolkit, download the .sof to the Intel Development Kit. Then, open the System Console and load the design to the System Console as well. Loading the .sof to the System Console allows the System Console to communicate with the design using NPDME. NPDME is a JTAG-based Avalon-MM master. It drives Avalon-MM slave interfaces in the PCIe design. When using NPDME, the Quartus® Prime software inserts the debug interconnect fabric to connect with JTAG.
Here are the steps to complete these tasks:
- Use the Quartus® Prime Programmer to download the .sof to the Intel FPGA Development Kit.
Note: To ensure correct operation, use a full installation of the Quartus® Prime Pro Edition Software and Devices of the same version of the Quartus® Prime Programmer and Quartus® Prime Pro Edition software that you used to generate the .sof.Note: A standalone install of the Quartus® Prime Pro Edition Programmer and Tools will not work.
- To load the design into System Console:
- Launch the Quartus® Prime Pro Edition software.
- Start System Console by choosing Tools, then System Debugging Tools, then System Console.
- On the System Console File menu, select Load design and browse to the .sof file.
- Select the .sof and click OK. The .sof loads to the System Console.
- The System Console Toolkit Explorer window will list all the DUTs in the design that have the Debug Toolkit enabled.
- Select the DUT with the Debug Toolkit you want to view. This will open the Debug Toolkit instance of that DUT in the Details window. An example of P-Tile Debug Toolkit is shown in the following figure.
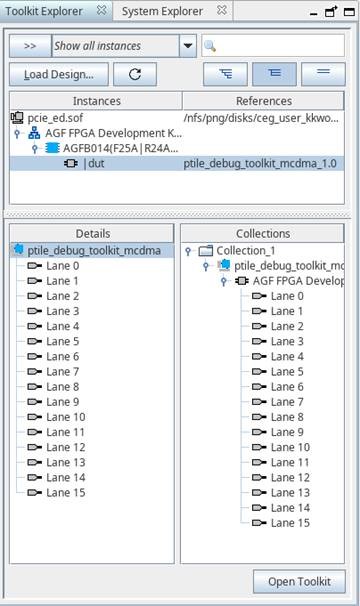
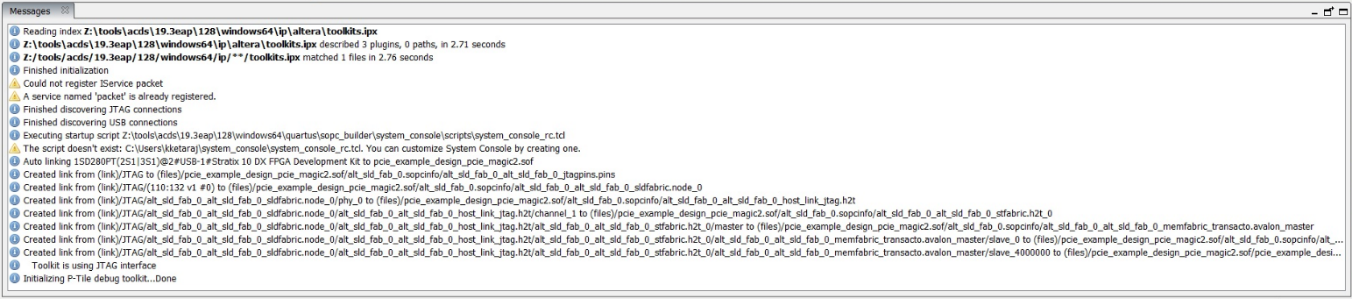
- Click on the ptile_debug_toolkit_mcdma to open that instance of the Toolkit. Once the Debug Toolkit is initialized and loaded, you will see the following message in the Messages window: “Initializing P-Tile debug toolkit – done”.
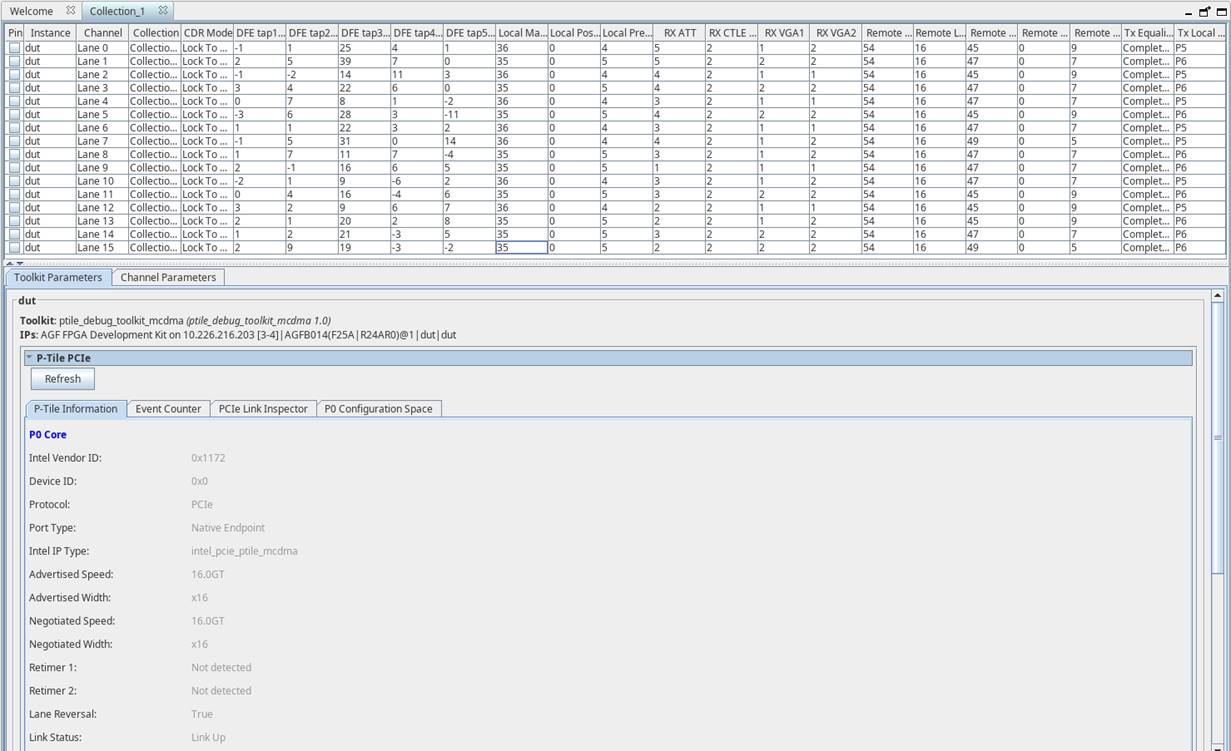
- A new window Main view will open with a view of all the channels in that instance.
- Select the DUT with the Debug Toolkit you want to view. This will open the Debug Toolkit instance of that DUT in the Details window. An example of P-Tile Debug Toolkit is shown in the following figure.