GPU Analysis with VTuneTM Profiler
VTuneTM Profiler is a performance analysis tool for serial and multi-threaded applications. It helps you analyze algorithm choices and identify where and how your application can benefit from available hardware resources. Use it to locate or determine:
Sections of code that don’t effectively utilize available processor resources
The best sections of code to optimize for both sequential and threaded performance
Synchronization objects that affect the application performance
Whether, where, and why your application spends time on input/output operations
Whether your application is CPU-bound or GPU-bound and how effectively it offloads code to the GPU
The performance impact of different synchronization methods, different numbers of threads, or different algorithms
Thread activity and transitions
Hardware-related issues in your code such as data sharing, cache misses, branch misprediction, and others
Profiling a SYCL application running on a GPU
The tool also has new features to support GPU analysis:
GPU Offload Analysis (technical preview)
GPU Compute/Media Hotspots Analysis (technical preview)
GPU Offload Analysis (Preview)
Use this analysis type to analyze code execution on the CPU and GPU cores of your platform, correlate CPU and GPU activity, and identify whether your application is GPU-bound or CPU-bound. The tool infrastructure automatically aligns clocks across all cores in the system so you can analyze some CPU-based workloads together with GPU-based workloads within a unified time domain. This analysis lets you:
Identify how effectively your application uses SYCL or OpenCLTM kernels.
Analyze execution of Intel Media SDK tasks over time (for Linux targets only).
Explore GPU usage and analyze a software queue for GPU engines at each moment in time.
GPU Compute/Media Hotspots Analysis (Preview)
Use this tool to analyze the most time-consuming GPU kernels, characterize GPU usage based on GPU hardware metrics, identify performance issues caused by memory latency or inefficient kernel algorithms, and analyze GPU instruction frequency for certain instruction types. The GPU Compute/Media Hotspots analysis lets you:
Explore GPU kernels with high GPU utilization, estimate the efficiency of this utilization, and identify possible reasons for stalls or low occupancy.
Explore the performance of your application per selected GPU metrics over time.
Analyze the hottest SYCL or OpenCL kernels for inefficient kernel code algorithms or incorrect work item configuration.
Run GPU Offload Analysis on a SYCL Application.
Using VTune Profiler to Analyze GPU Applications
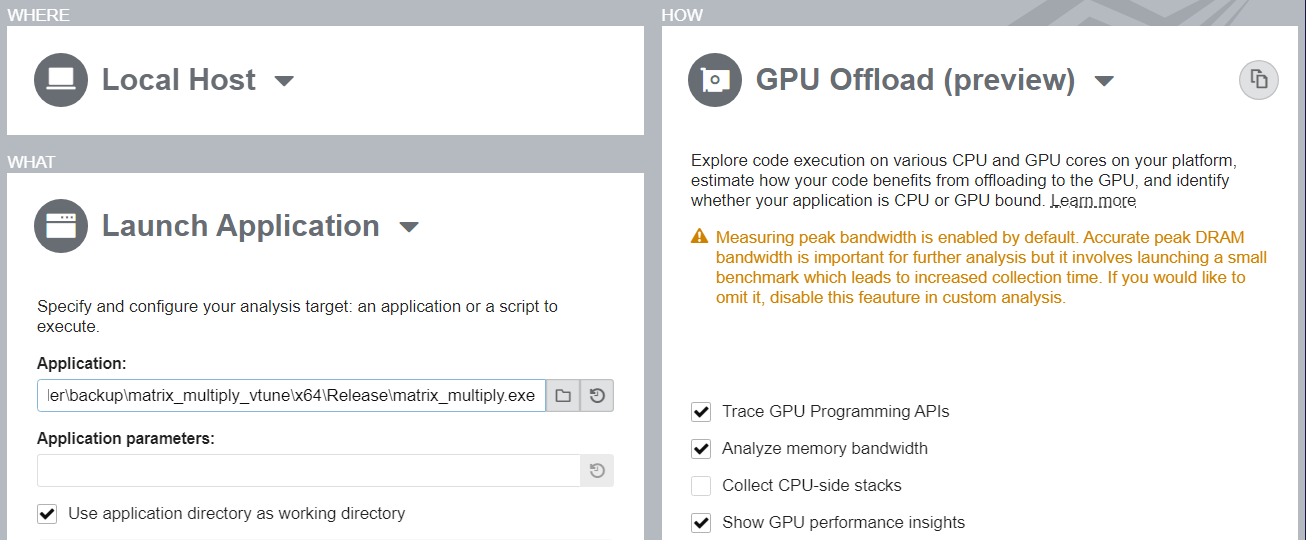
Launch VTune Profiler and from the Welcome page, click New Project. The Create a Project dialog box opens.
Specify a project name and a location for your project and click Create Project. The Configure Analysis window opens.
Make sure the Local Host is selected in the WHERE pane.
In the WHAT pane, make sure the Launch Application target is selected and specify the matrix_multiply binary as an Application to profile.
In the HOW pane, select the GPU Offload analysis type from the Accelerators group.
Click Start to launch the analysis.
This is the least intrusive analysis for applications running on platforms with Intel Graphics as well as third-party GPUs supported by VTune Profiler.
Run Analysis from the Command Line
To run the analysis from the command line:
On Linux* OS:
Set VTune Profiler environment variables by sourcing the script:
source <*install_dir*>/env/vars.sh
Run the analysis command:
vtune -collect gpu-offload -- ./matrix.dpcpp
On Windows* OS:
Set VTune Profiler environment variables by running the batch file:
export <*install_dir*>\env\vars.bat
Run the analysis command:
vtune.exe -collect gpu-offload -- matrix_multiply.exe
Analyzing Collected Data
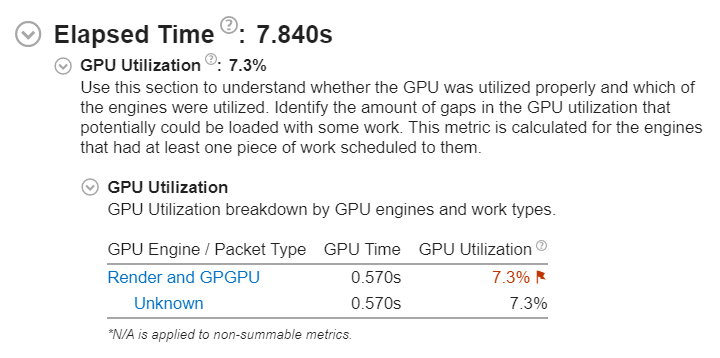
Start your analysis with the GPU Offload viewpoint. In the Summary window, you can see see statistics on CPU and GPU resource usage to determine if your application is GPU-bound, CPU-bound, or not effectively utilizing the compute capabilities of the system. In this example, the application should use the GPU for intensive computation. However, the result summary indicates that GPU usage is actually low.
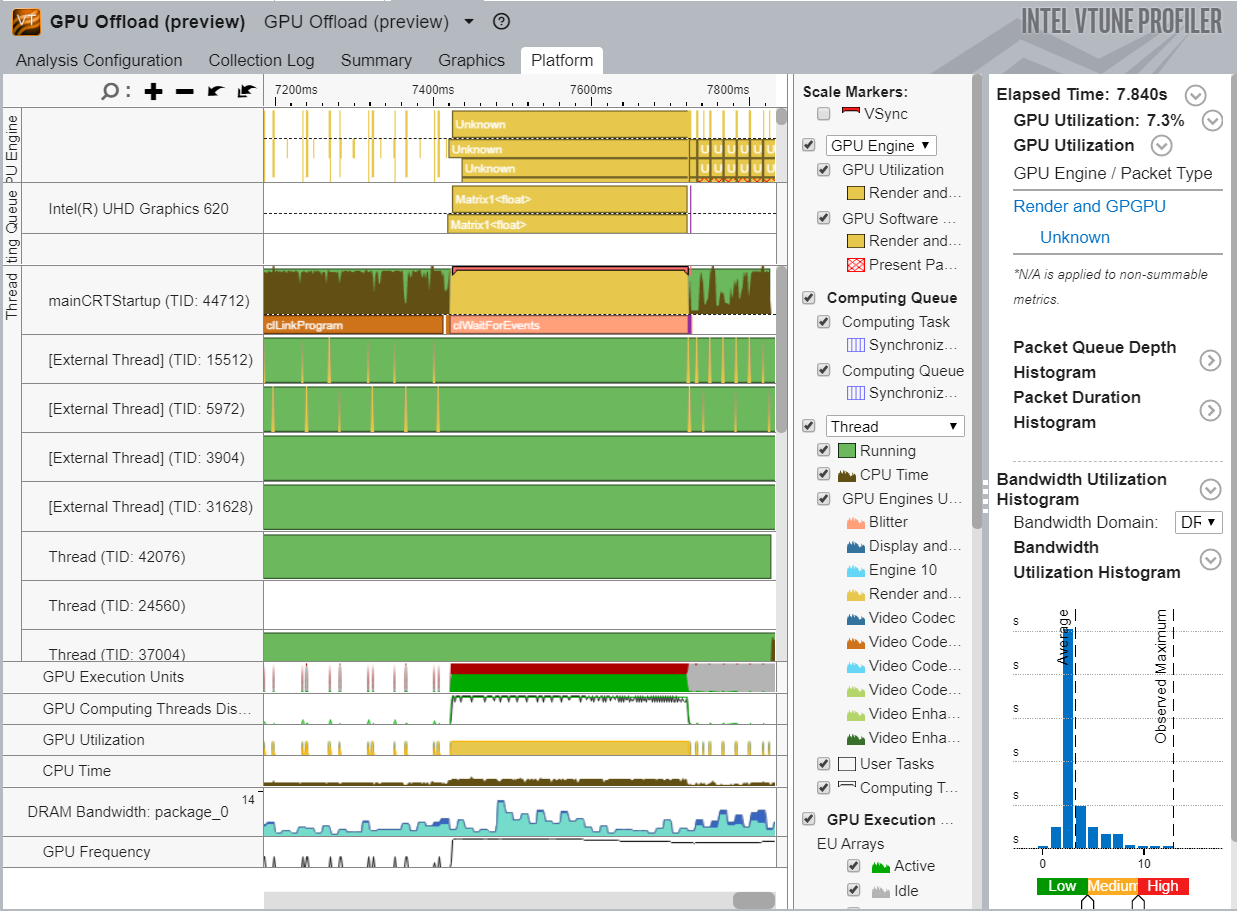
Switch to the Platform window. Here, you can see basic CPU and GPU metrics that help analyze GPU usage on a software queue. This data is correlated with CPU usage on the timeline. The information in the Platform window can help you make some inferences.
Most applications may not present obvious situations as described above. A detailed analysis is important to understand all dependencies. For example, GPU engines that are responsible for video processing and rendering are loaded in turns. In this case, they are used in a serial manner. When the application code runs on the CPU, this can cause ineffective scheduling on the GPU, which can lead you to mistakenly interpret the application as GPU bound.
Identify the GPU execution phase based on the computing task reference and GPU Utilization metrics. Then, you can define the overhead for creating the task and placing it in a queue.
To investigate a computing task, switch to the Graphics window to examine the type of work (rendering or computation) running on the GPU per thread. Select the Computing Task grouping and use the table to study the performance characterization of your task. To further analyze your computing task, run the GPU Compute/Media Hotspots analysis type.

Run GPU Compute/Media Hotspots Analysis
To run the analysis:
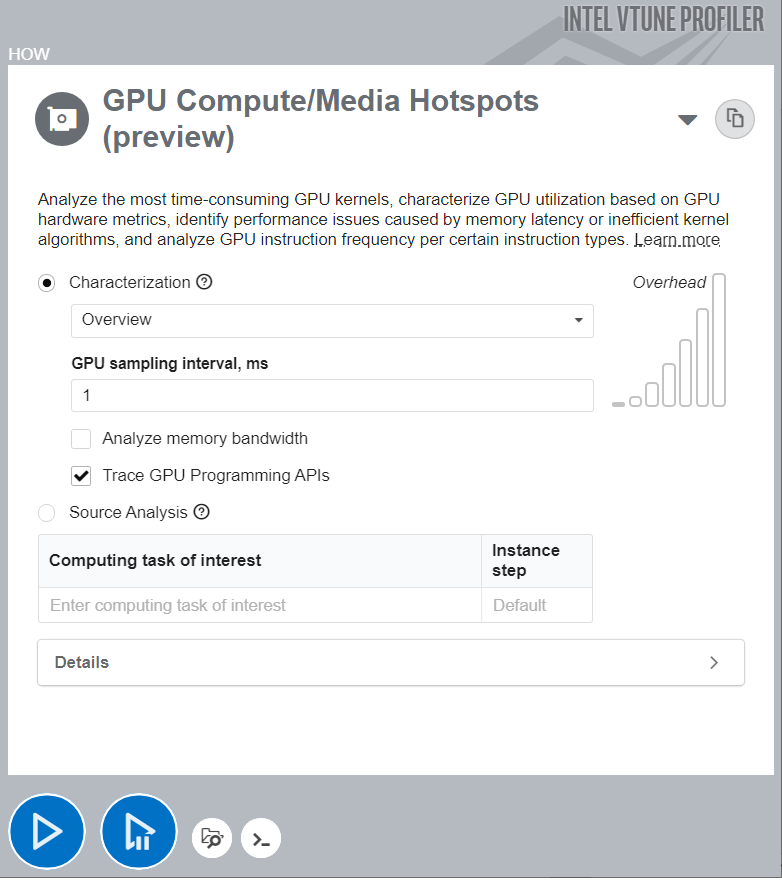
In the Accelerators group, select the GPU Compute/Media Hotspots analysis type.
Configure analysis options as described in the previous section.
Click Start to run the analysis.
Run Analysis from the Command line
On Linux OS:
vtune -collect gpu-hotspots -- ./matrix.dpcpp
On Windows OS:
vtune.exe -collect gpu-hotspots -- matrix_multiply.exe
Analyze Your Compute Tasks

The default analysis configuration invokes the Characterization profile with the Overview metric set. In addition to individual compute task characterization available through the GPU Offload analysis, VTune Profiler provides memory bandwidth metrics that are categorized by different levels of GPU memory hierarchy.
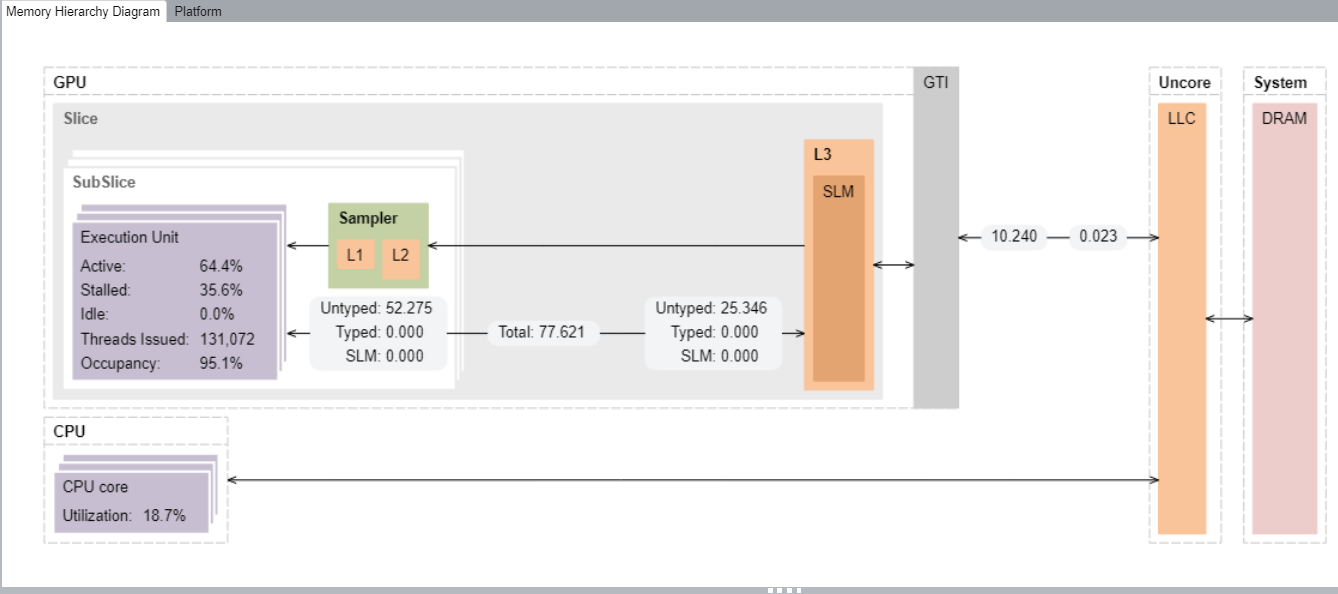
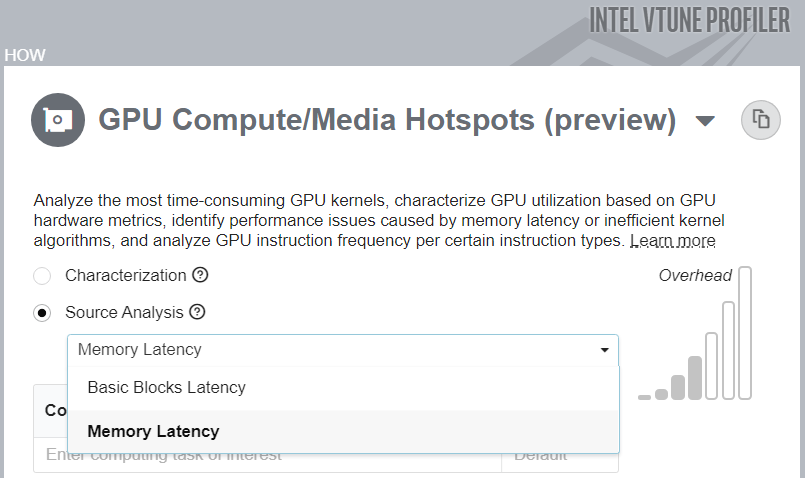
You can analyze compute tasks at source code level too. For example, to count GPU clock cycles spent on a particular task or due to memory latency, use the Source Analysis option.
Use our matrix multiply example in SYCL:
// Basic matrix multiply
void multiply1(int msize, int tidx, int numt, TYPE a[][NUM], TYPE b[][NUM],
               TYPE c[][NUM], TYPE t[][NUM]) {
  int i, j, k;

  // Declare a deviceQueue
  sycl::default_selector device;
  sycl::queue q(device, exception_handler);
  cout << "Running on " << q.get_device().get_info<sycl::info::device::name>()
       << "\n";
  // Declare a 2 dimensional range
  sycl::range<2> matrix_range{NUM, NUM};

  // Declare 3 buffers and Initialize them
  sycl::buffer<TYPE, 2> bufferA((TYPE *)a, matrix_range);
  sycl::buffer<TYPE, 2> bufferB((TYPE *)b, matrix_range);
  sycl::buffer<TYPE, 2> bufferC((TYPE *)c, matrix_range);
  // Submit our job to the queue
  q.submit([&](auto &h) {
     // Declare 3 accessors to our buffers. The first 2 read and the last
     // read_write
     sycl::accessor accessorA(bufferA, h, sycl::read_only);
     sycl::accessor accessorB(bufferB, h, sycl::read_only);
     sycl::accessor accessorC(bufferC, h);

     // Execute matrix multiply in parallel over our matrix_range
     // ind is an index into this range
     h.parallel_for(matrix_range, [=](sycl::id<2> ind) {
       int k;
       for (k = 0; k < NUM; k++) {
         // Perform computation ind[0] is row, ind[1] is col
         accessorC[ind[0]][ind[1]] +=
             accessorA[ind[0]][k] * accessorB[k][ind[1]];
       }
     });
   }).wait_and_throw();
} // multiply1
Analyzing the GPU-offload report from the command-line gives detailed recommendations on how to optimize the application.
Elapsed Time: 2.805s
    GPU Utilization: 3.3%
    GPU utilization is low. Consider offloading more work to the GPU to
    increase overall application performance.


        GPU Utilization
        GPU Engine        Packet Type  GPU Time     GPU Utilization(%)
        ----------------  -----------  --------  ---------------------
        Render and GPGPU  Unknown        0.091s                   3.3%

Hottest GPU Computing Tasks
Computing Task  Total Time  Execution Time  % of Execution(%)  Instance Count
--------------  ----------  --------------  -----------------  --------------
Matrix1<float>      0.183s          0.086s              47.0%               1

Recommendations:
   GPU Utilization: 3.3%
   GPU utilization is low. Switch to the Graphics View for in-depth analysis
   of host activity. Poor GPU utilization can prevent the application from
   offloading effectively.
Transfer Time: 0.097s
   Execution time on the device is less than memory transfer time. Make sure
   your offload schema is optimal. Use the Intel Advisor tool to get an
   insight into possible causes of inefficient offload.
We can also examine how efficiently our GPU kernel is running using GPU-hotspots. How often our execution units are stalled can be a good indication of GPU performance. Another important metric is whether we are L3 bandwidth bound. In our case VTune is indicating that our L3 bandwidth was high when VEs were stalled.
Elapsed Time: 1.849s
GPU Time: 0.090s

EU Array Stalled/Idle: 6.2%
GPU L3 Bandwidth Bound: 65.2%

L3 bandwidth was high when VEs were stalled or idle.
Consider improving cache reuse.

FPU Utilization: 76.4%
For more ways to optimize GPU performance using VTune Profiler, see Software Optimization for Intel® GPUs in the Intel® VTune™ Profiler Performance Analysis Cookbook and Optimize Applications for Intel® GPUs with Intel® VTune™ Profiler .