A newer version of this document is available. Customers should click here to go to the newest version.
Visual Studio* Integration
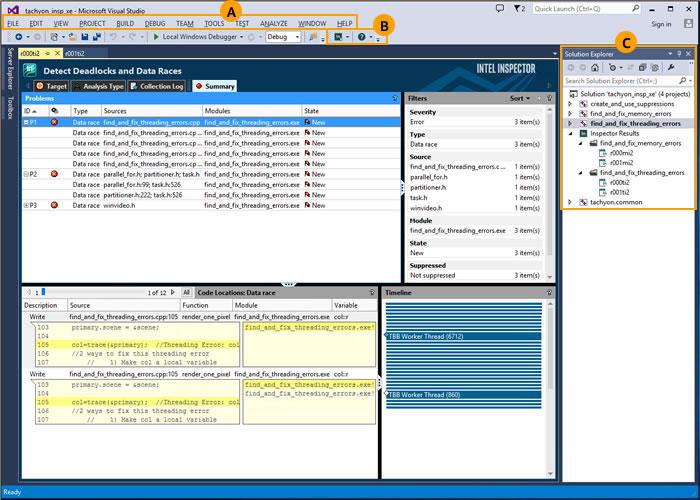
Intel® Inspector integrates into the Visual Studio* integrated development environment (IDE) and can be accessed from the menus, toolbar, and Solution Explorer in the following manner:
The menu, toolbar, and Solution Explorer offer different ways to perform many of the same functions. |
|
A |
Use the Tools > Intel Inspector [version] menu to create analysis results; compare results; and import result archive files, results not associated with a project, and results from other Intel error-detection products into the current project. |
B |
Use the Intel Inspector toolbar to open the Getting Started page, create analysis results, compare results, and configure projects. |
C |
Solution Explorer context menus (right-click to open):
|