Introduction
Performance is a key factor in designing and shipping best of class products. Optimizing performance requires visibility into system behavior. Here in this paper focus is given on using Intel® VTune™ Amplifier to profile Data Plane Development Kit (DPDK) code.
The reader will find this paper as a comprehensive reference and cook book style guidelines to install and use Intel® VTune™ Amplifier and run and profile couple of DPDK micro benchmarks (often referred as the best kept secret) as an example of getting deep visibility into system, cores communication and core pipeline and usage.
Extensive screenshots are given for the readers to compare their output with the screenshots. The commands are given, in addition, so that the readers can copy and paste the commands wherever possible.
About The Author

M Jay has worked with the DPDK team from 2009 onwards. M Jay joined Intel in 1991 and has been in various roles and divisions with Intel – 64 bit CPU front side bus architect, 64 bit HAL developer to mention a few before DPDK team. M Jay holds 21 US Patents, both individually and jointly, all issued while working in Intel. M Jay was awarded the Intel Achievement Award in 2016, Intel's highest honor based on innovation and results.
Outline
- Install Linux*
- Install Data Plane Development Kit (DPDK)
- Install the tools
- Source editor
- Intel® VTune™ Amplifier
- Install & Profile the application of your choice
- Distributor Application
- Ring Tests Application
- Conclusion and Next Steps
Install Linux
From the Linux DVD with iso image
http://old-releases.ubuntu.com/releases/15.04/ubuntu-15.04-desktop-amd64.iso
Prior to Install:
If you have a laptop installed with Windows* 8, go to safe mode (SHIFT+RESTART).
Once in safe mode, choose boot option # 1 to boot from the external USB DVD drive.
Restart and install.
NOTE: In this paper, for example, we have installed Ubuntu* 15.04. Please refer for system details in Appendix 3.
After Install:
- Verify whether the kernel version installed is the correct version as per the DPDK release notes.
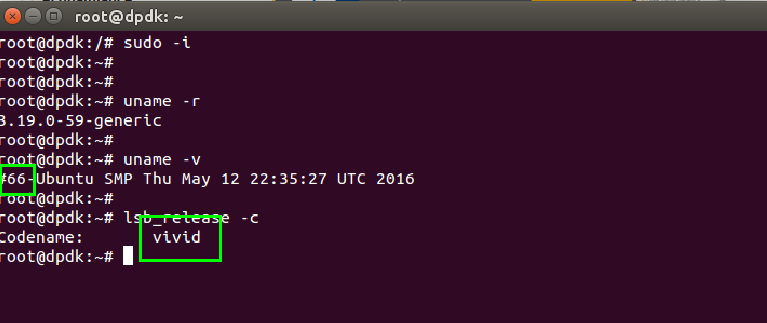
$uname –a

The above output verifies the Kernel release as 3.19.0-59-generic, the version number as #66, and the distro as Ubuntu 64 bit.
$uname –v
Gives the version # – version #66 as shown below.
$lsb_release –c
Gives the code name – the code name is vivid as shown below.
- Verify Internet connectivity. In some cases the network-manager service has to be restarted for the Ethernet service to be operational.
$ sudo service network-manager restart

The next step is to install the DPDK.
Download DPDK
- Get the latest DPDK release as shown below and in the screenshot.
$ sudo wget www.dpdk.org/browse/dpdk/snapshot/dpdk-16.04.tar.xz
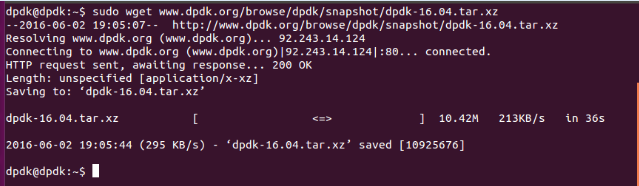
The response for the above command is as shown below.
You will find the DPDK tar file downloaded as shown below.
$ ls
- Extract the tar ball.
$ tar xf dpdk-16.04.tar.xz
- You will find that the directory dpdk-16.04 was created.
$ ls
- Change to the DPDK directory to list the files.
$ cd dpdk-16.04
$ ls –al
Install the Tools
Install the source editor of your choice. Here, CSCOPE is chosen.
- First check to see whether the correct repository is enabled.
Check that the universe repository is enabled by inspecting '/etc/apt/sources.list'
$ sudo gedit /etc/apt/sources.list
As highlighted below, you may see “restricted” [both highlighted and the line below] and not having “universe”
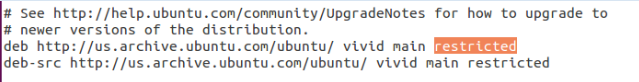
In that case, edit the file by replacing “restricted” with “universe” [both highlighted and the line below], as shown below.
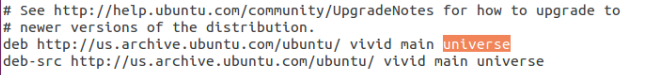
Now save the file.
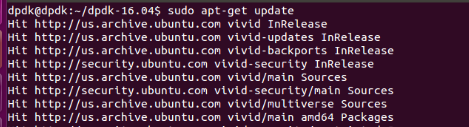
- Update the system.
$ sudo apt-get update

The system gets the updating as shown below.
Install CSCOPE.
$ sudo apt-get install cscope
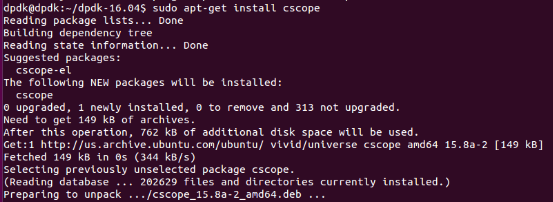
As shown above, CSCOPE 15.8a-2 is installed.
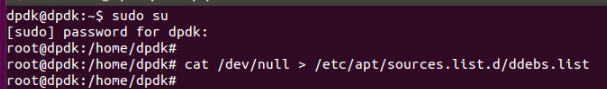
Install Kernel Debug Symbols
- The first step is to add the repository containing debugging symbols.
- For that, first create a new file ddebs.list (if it does not exist already).
$ cat /dev/null > /etc/apt/sources.list.d/ddebs.list
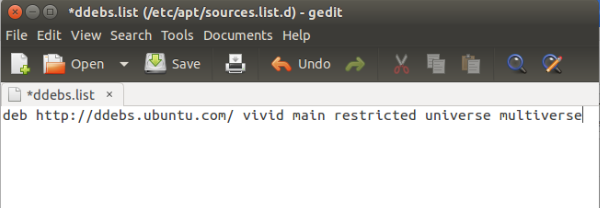
- Next edit the file.
$ gedit /etc/apt/sources.list.d/ddebs.list

- Add the following line to /etc/apt/sources.list.d/ddebs.list as shown below and save it.
deb http://ddebs.ubuntu.com/ vivid main restricted universe multiverse
- Update the system to load the package list from the new repository.
$ sudo apt-get update

In this case, the system gave the following error.
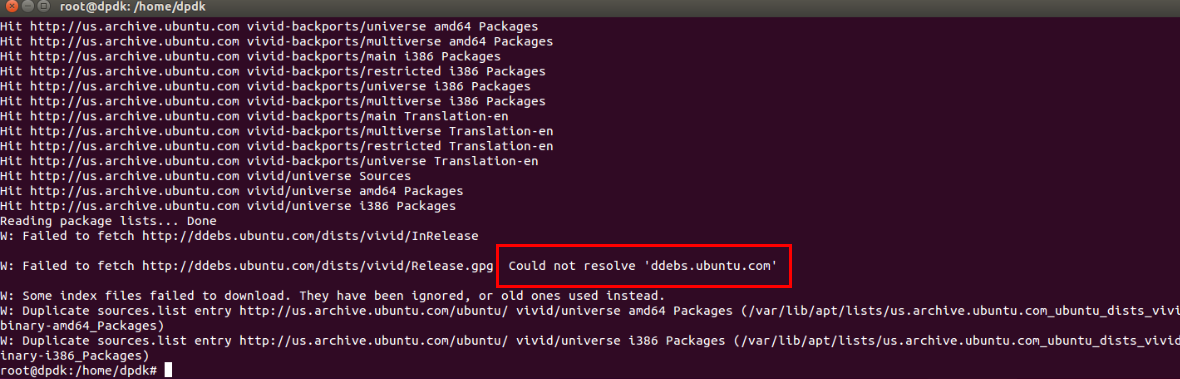
If you don’t see the resolution error in your system, skip the instructions here that are colored in red and proceed to the next section.
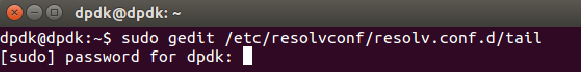
- To resolve name servers:
$ sudo gedit /etc/resolvconf/resolv.conf.d/tail
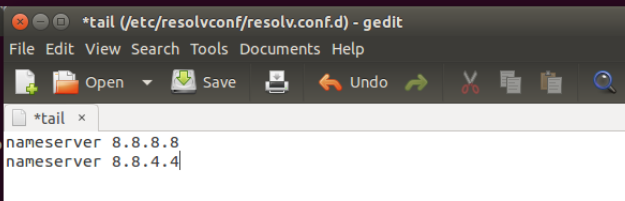
- Add these two name servers (below).
- Save the file.
- Restart the service.
$ sudo /etc/init.d/resolveconf restart
If the sudo apt-get update is done now without resetting the system, it still gives the resolve error.
It is recommended to shut down and restart the system.
- After the shutdown and restart, restart the service.
$ sudo /etc/init.d/resolvconf restart
- Update the system.
$ sudo apt-get update
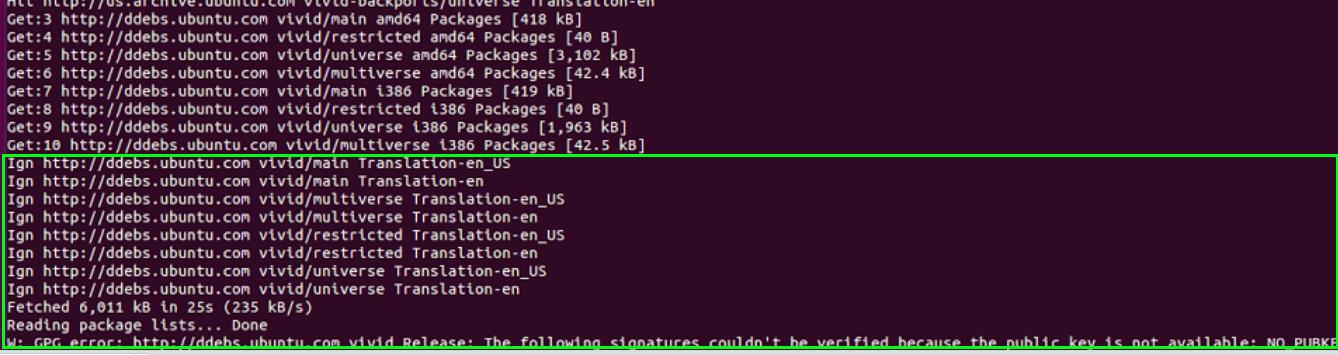
With the above steps, access to http://ddebs.ubuntu.com has been resolved.
However there is a new error “GPG error” as shown at the bottom of the screenshot above.
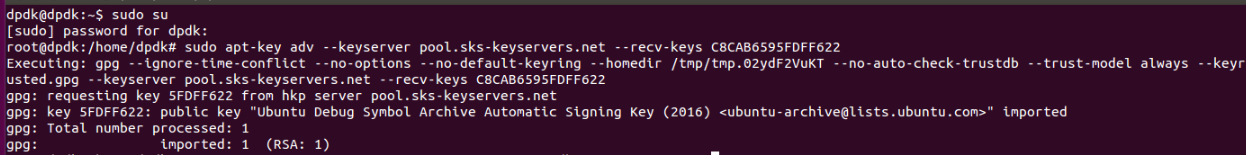
- Add the GPG key.
$ sudo apt-key adv –keyserver pool.sks-keyservers.net –recv-keys C8CAB6595FDFF622
With the repository added, the next step is to install the symbol package by running the following command:
apt-get install linux-image-<release>-dbgsym=<release>.<version>
With the release as 3.19.0-59-generic and the version as 66 this is:
$ apt-get install linux-image-3.19.0-59-generic-dbgsym=3.19.0-59.66
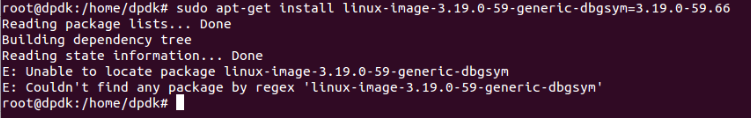
Please note that the above resulted in an error because it could not locate the package linux-image-3.19.0-59-generic-dbgsym. If you want to set breakpoints by function names and viewing local variables, this error must be resolved.
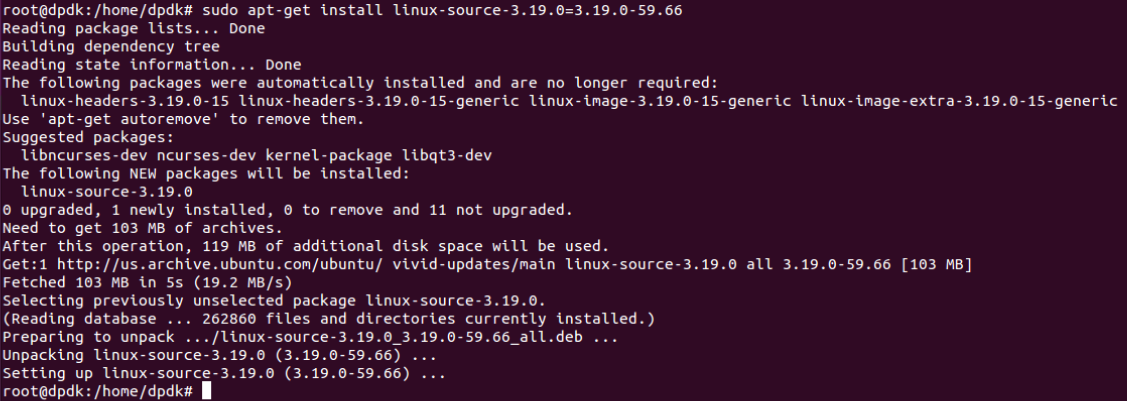
Install the Linux Source Package
$ sudo apt-get install linux-source-3.19.0=3.19.0-59.66
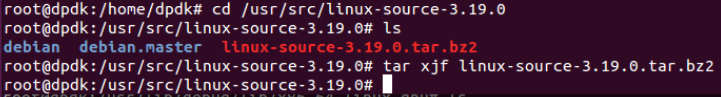
- With the package now installed, go to /usr/src/linux-source-3.19.0 and unpack the source tarball.
$ cd /usr/src/linux-source-3.19.0
$ tar xjf linux-source-3.19.0.tar.bz2
Set Up Intel® VTune Amplifier
Click here to get to the following Intel VTune Amplifier download page.
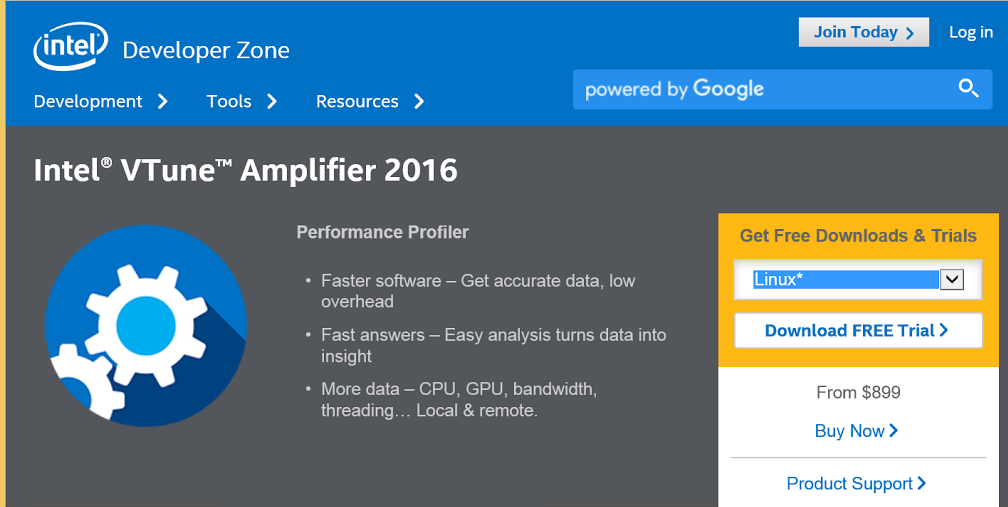
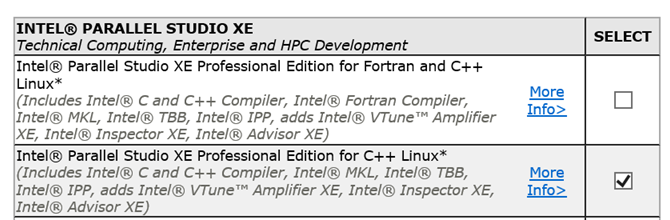
The product comes with multiple options (examples: for Windows, for Linux*, with only C /C++, or with Fortran and C/C++. Select the option you want as shown below.
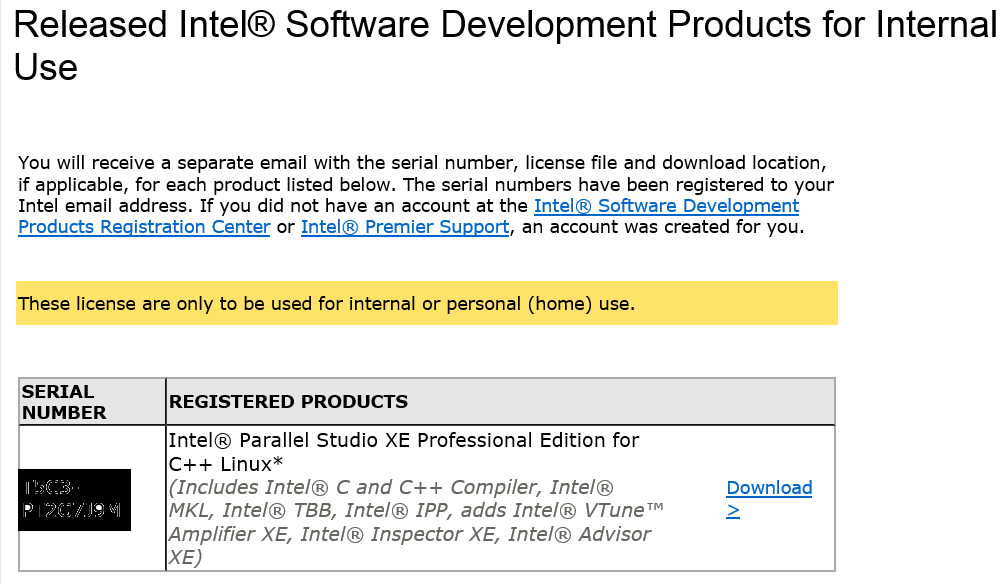
After you submit your selection, you will get a separate e-mail with 1) serial number, 2) license file attached and 3) download location as shown in the screenshot below.
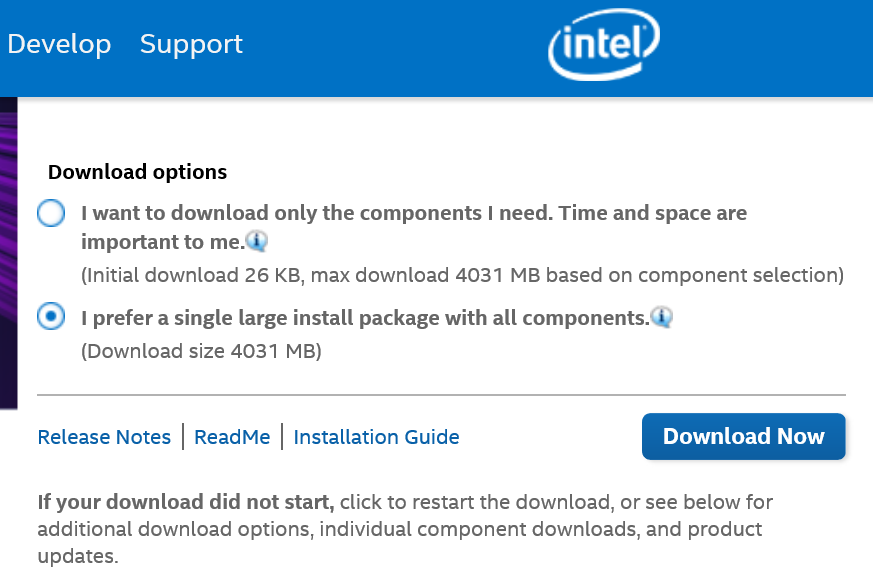
After clicking Download, you will be presented with two options as shown in the screenshot below, with the default option selected for single install package with all components.
Note that in addition to the getting started guide for Intel VTune Amplifier, there are three other useful documents as shown in the screenshot below: the release notes, ReadMe, and the installation guide.
Access the Intel VTune Amplifier Getting Started Guide.
For hardware event-based sampling, verify the sampling driver is installed properly as shown in
https://software.intel.com/en-us/sep_driver
The Intel VTune Installation Guide is at https://software.intel.com/en-us/Intel-VTune-Amplifier-XE-Install-Guide-Linux
Later when you untar the Intel VTune Amplifier package, you will find the installation guide’s PDF file that comes with the package. It is recommended that you use that file.
You can access Intel VTune Amplifier ReadMe at Intel® Parallel Studio XE Release Notes and New Features
Access Intel VTune Amplifier release notes at
https://software.intel.com/en-us/articles/intel-vtune-amplifier-xe-release-notes
At this point you have six different important items.
- Image – parallel_studio_xe_2016_update3.tgz
- Serial number
- License file
- Release notes
- ReadMe file
- Installation guide
Registering your product with the serial number
Register your product at https://lemcenter.intel.com so that when you install (using serial number method, if you choose) successful authentication is possible.
Since VTune supports Ubuntu 15.10 from update 2 and later, and since we’re using Intel VTune Amplifier update 3 Ubuntu 15.04, our Ubuntu version is verified as being supported with the Intel VTune Amplifier version we are using, as per the release notes.
Please take time to read the release notes, ReadMe file, and installation guide. Taking notes and highlighting the steps you need to do will make following the steps easier.
- Note the serial number you got through e-mail.
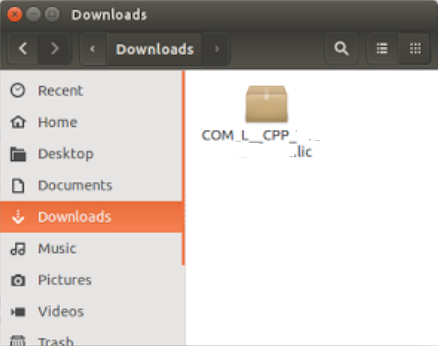
- Download the License File, .lic (shown in the download folder below)
Untar the Intel VTune Amplifier Package
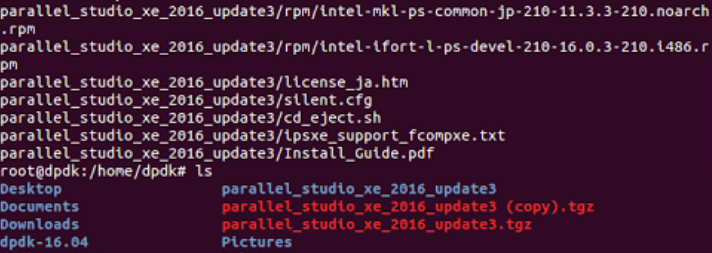
$ tar –zxvf parallel_studio_xe_2016_update3.tgz

You will see the following output as an example. Specifically, a new directory has been created named parallel_studio_xe_2016_update3
Some of the files are noteworthy.
$ cd parallel_studio_xe_2016_update3
$ ls
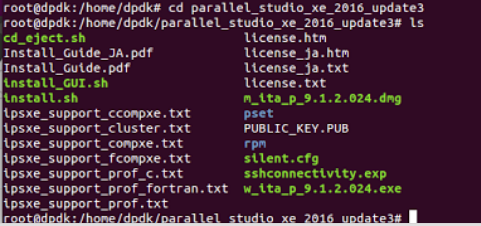
Note that Install_Guide.pdf resides in the directory shown above. Since this directory comes with the package, following this installation guide is more suitable for these installation steps.
install_GUI.sh and install.sh are the install files for GUI and the command line, respectively.
silent.cfg is the configuration file used in non-interactive (that is, silent) mode for installation.
VTune Installation Steps
In this example, we will use interactive installation and install_GUI.sh.
$ ./install_GUI.sh
The resulting successive screens with queries are shown in Appendix 1.
Verify and compare notes with your screen outputs to those shown in Appendix 1.
Following are the steps after successful complete installation.
Verifying whether the driver is installed
By default, using interrupt sampling mode should work indicating the driver is installed correctly. If interrupt sampling mode is not working properly, verify whether the driver is installed correctly. The verification steps are listed in Appendix 2.
Following are the steps after successful verification.
Before Starting Intel VTune Amplifier
Before starting Intel VTune Amplifier, let’s take a quick look at the directory structure and the key files.
amplxe-vars.sh and amplxe-vars.csh shown below are for setting environment variables.
Please note the softlinks vtune_amplifier_xe_2016 and vtune_amplifier_xe are listed below.
Starting Intel VTune Amplifier
Note that <install_dir> is /opt/intel/vtune_amplifier_xe_2016
- Set up the environment variables.
source <install_dir>/amplxe-vars.sh translates to
$ source /opt/inte/vtune_amplifier_xe_2016/amplxe-vars.sh
- Launch Intel VTune Amplifier in graphic mode.
$ amplxe-gui
You will see Intel VTune Amplifier launching as shown below.
Click Getting Started in the welcome banner to open the Getting Started instructions specific to the Intel VTune Amplifier installed.
Now you can start building your project as per the steps shown in the Getting Started notes.
In this paper, we will profile couple of DPDK performance functions to illustrate VTune profiling of DPDK code.
Stepping Back & Seeing the Big Picture
It behooves to step back and see the big picture first – as what other components exist in the system. If there is some unrelated component consuming resources and if we only focus on measuring our specific application, then we may be coming to wrong conclusion because of partial information.
So, here, even before running DPDK application, we are just running top –H and see where CPU is spending its cycles even without our specific application running.
Below you will see VTune showing top –H running as well as web browser running. Now the user can understand that top is something user just ran whereas web browser is something he does not want to take CPU cycles while running the application of interest. Similarly the user may find some unwanted daemons. So, the user stops the unwanted applications, daemons and any other components.
Pointing to the Source Directory
The following screenshot shows in VTune how to point to the source directory of the s/w components of interest. You can add multiple directories.
Profiling DPDK code with VTune
1. Reserving Huge Page Creating /mnt/huge and mounting as hgetlbfs:
$ cd /home/dpdk/dpdk-16.04
$ sudo su
$ echo 128 > /sys/kernel/mm/hugepages/hugepages-2048kB/nr_hugepages
Please note that 128 is chosen here with memory constrain in the laptop chosen. In case you are using server/desktop 1024 can be chosen.


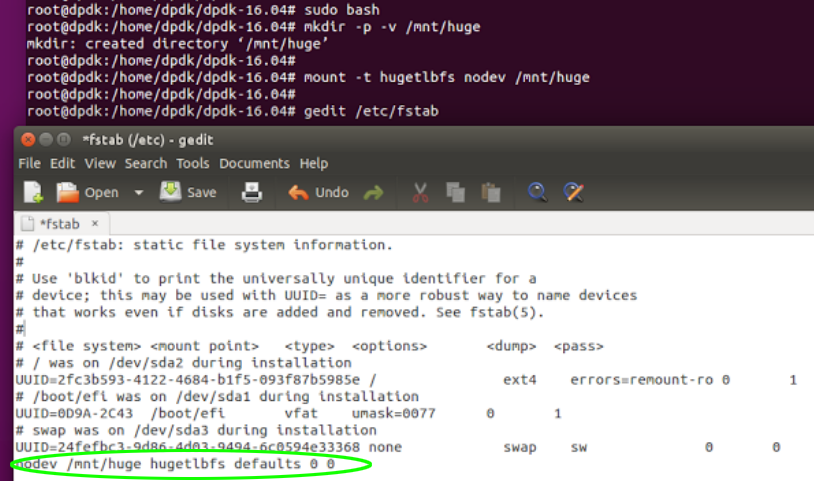
2. Creating /mnt/huge and mounting as hgetlbfs:
$ sudo bash
$ mkdir –p –v /mnt/huge [-v for verbose, as you can see below response from the system]
$ mount –t hugetlbfs nodev /mnt/huge
Making the mount point permanent across reboots, by adding the following line to the /etc/fstab file:
nodev /mnt/huge hugetlbfs defaults 0 0
3. Building DPDK Test Application & DPDK Library:
$ export RTE_SDK=/home/dpdk/dpdk-16.04
$ export RTE_TARGET=x86_64-native-linuxapp-gcc
$ export EXTRA_CFLAGS=’-g’ [For DPDK symbols]
$ make install T=x86_64-native-linuxapp-gcc DESTDIR=install
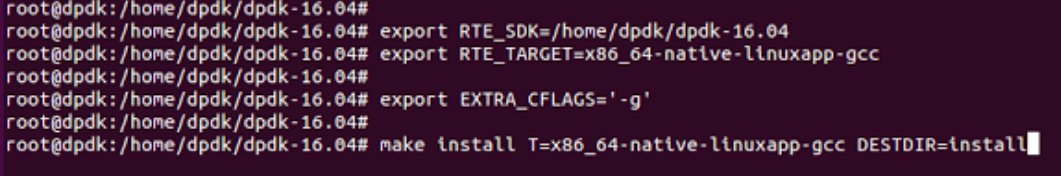
The output of build will complete successfully as shown below.
4. Enable Userspace IO for DPDK by Loading uio Modules:
$ sudo modprobe uio
$ sudo insmod x86_64-native-linuxapp-gcc/kmod/igb_uio.ko
5. Add path to Symbols (DPDK Test Application) in VTune:
You can verify the symbols in the above directory in .map file
Profiling DPDK Code with VTune Amplifier
$ cd /home/dpdk/dpdk-16.04/x86_64-native-linuxapp-gcc/app
$ sudo su
$ ./test
The test will issue prompt RTE>> as shown below.
$ ? will give the list of tests and help.
Next we will run a handful of microbenchmarks.
Profiling Distributor Perf Autotest
RTE>> distributor_perf_autotest
The summary highlights CPI rate indicating it is beyond the normal range. It also highlights “Back End Bound” indicating memory bound application nature.
The details are shown below:
The Function/Call Stack indicates rte_distributor_poll_pkt consumes CPI rate of 3.720 and _mm_pause consuming CPI rate of 3.867.
You can observe rte_distributor_get_pkt runs with CPI rate of 26.30. However it is not highlighted since it does not run as many clock ticks as other functions.
You will see other functions listed here along with the CPI each one takes – rte_distributor_process, rte_distributor_request_pkt, time_cache_line_switch for instance.
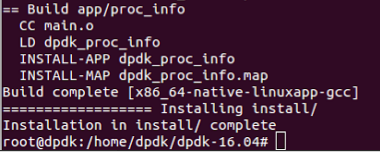
Profiling Rings
The Communication between cores for interprocessor communication as well as communication between cores and NIC happens through rings and descriptors.
While NIC hardware does optimizations in terms of RS bit and DD bit (Descriptor Done bit) in bunching the data size, DPDK in addition enhances bunching with amortizing by offering API for bulk communication through rings.
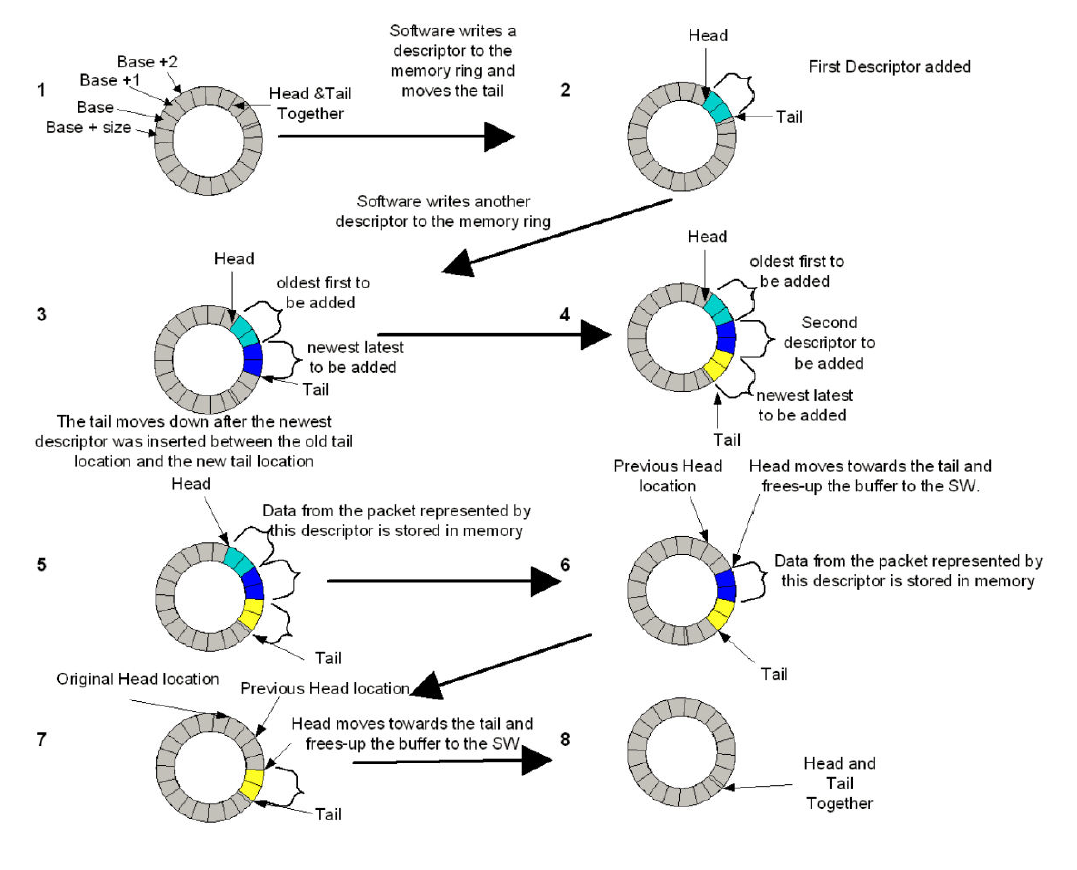 The rings tests show Single producer single consumer (SP/SC) with bulk sizes both in enqueue / dequeue gives best performance compared to Multiple producers multiple consumers (MP/MC). Below are the steps.
Profiling ring_perf_autotest
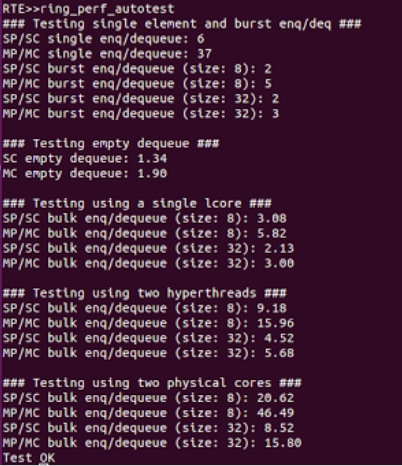
Below the rings tests show in detail that the code is backend bound and you can see the call stack showing the Single producer single consumer (SP/SC) with bulk sizes as well Multiple producers multiple consumers (MP/MC).
To appreciate relative performance of SP/SC with single data size and bulk size and comparing with MP/MC with single data size and bulk size following graph can be referred. Please note the impact of core placement – a) siblings, b) within the same socket, c) across multi sockets.
Conclusion & Next Steps
Practice profiling on additional sample DPDK applications. With the experience you gather, extend the profiling and optimization to your own applications that you are building on top of DPDK.
Get plugged into the DPDK community to learn on the latest from developers and architects and keep your products highly optimized. Register at http://www.dpdk.org/ml/listinfo/dev
Reference
Enabling Internet connectivity:
http://askubuntu.com/questions/641591/internet-connection-not-working-in-ubuntu-15-04
Getting Kernel Symbols/Sources on Ubuntu Linux:
http://sysprogs.com/VisualKernel/tutorials/setup/ubuntu/
How to debug libraries in Ubuntu:
http://stackoverflow.com/questions/14344654/how-to-use-debug-libraries-on-ubuntu
How to install a package that contains Ubuntu debug symbols:
Debug symbol packages:
https://wiki.ubuntu.com/Debug%20Symbol%20Packages
Ask Ubuntu for challenges in Apt-get update failure to fetch:
http://askubuntu.com/questions/135932/apt-get-update-failure-to-fetch-cant-connect-to-any-sources
DNS Name Server IP Address:
http://www.cyberciti.biz/faq/ubuntu-linux-configure-dns-nameserver-ip-address/
How to fix Public Key is not available issue:
Ubuntu Key server: http://keyserver.ubuntu.com:11371/
Installing CSCOPE:
http://installion.co.uk/ubuntu/vivid/init/c/cscope/install/index.html
http://freecode.com/projects/cscope
Performance optimization:
http://www.agner.org/optimize/instruction_tables.pdf
Intel VTune Amplifier data collection:
Intel® Parallel Studio XE and Intel® System Studio Data Collection
Using Intel VTune Amplifier with a virtual machine: Targets in Virtualized Environments
Challenges in installing VTune? Refer these links below:
http://software.intel.com/en-us/articles/vtune-amplifier-xe-2013-u3-works-on-customized-embedded-linux-system
http://softwareproducts.intel.com/ilc/
Appendix 1: Intel VTune Amplifier Install Steps
For the input ./install_GUI.sh following are the screen outputs.
- Welcome Screen
- Prerequisites
- End User License Agreement
- Activation Using Serial Number
- Intel® Software Improvement Program
- Options
- Installation of Open Source Components
- Installation starts with all the above-selected items
- Installation complete
The following three steps and associated screenshots are recommended for gaining additional insight in using Intel® VTune™ Amplifier.
- Click Finish to view the file on the local machine at file:///opt/intel/documentation_2016/en/ps2016/getstart_prof_lc.htm
- To see a product tour with videos and sample apps
https://software.intel.com/content/www/us/en/develop/articles/evaluate-ipsxe-professional-linux.html
- To evaluate Intel® Parallel Studio XE access, view the local file on the local machine at
file:///opt/intel/documentation_2016/en/ps2016/startup_prof_lc.htm
Appendix 2
Please run the steps in the installation guide to verify the driver’s proper installation.
Appendix 3
System Details
Legal Disclaimer
Intel technologies’ features and benefits depend on system configuration and may require enabled hardware, software or service activation. Learn more at intel.com, or from the OEM or retailer.
No computer system can be absolutely secure.
Tests document performance of components on a particular test, in specific systems. Differences in hardware, software, or configuration will affect actual performance. Consult other sources of information to evaluate performance as you consider your purchase. For more complete information about performance and benchmark results, visit http://www.intel.com/performance.
Intel, the Intel logo and others are trademarks of Intel Corporation in the U.S. and/or other countries. *Other names and brands may be claimed as the property of others.
© 2016 Intel Corporation.