Following the Innovation 2022 session on Code Design and Optimization for Next Generation CPUs and Compute Accelerators with oneAPI Analysis Tools, our application optimization experts decided to dive deeper into the real world usage of the multiarchitecture performance profiling capabilities presented there.
This is a step-by-step journey that takes a real-world application and …
- Executes it first on the CPU,
- Enables SYCL*-based GPU offload, and
- Improves performance by applying findings and guidance from Intel® VTune™ Profiler, an analysis tool for quickly finding and fixing bottlenecks in applications, systems, and system configurations (CPUs, GPUs, and other accelerators).
We will set the baseline and then will illustrate the benefits in performance analysis you can reap from this comprehensive and powerful tool when it’s applied to workloads running on a GPU.
After reading this article, you will be ready to optimize your own heterogeneous application on both CPU and GPU.
Note that this tutorial will be done in the Intel® DevCloud environment, a free cloud-base sandbox to learn about programming using Intel® oneAPI tools on the latest Intel® hardware.
Quick Overview: What Is VTune™ Profiler?
It is a powerful analysis and optimization tool that helps locate software performance bottlenecks by collecting, analyzing, and displaying system-wide performance data down to the source level. It provides profiling capabilities for application performance, system performance, and system configuration for HPC, cloud, IoT, and more.
Key Features
- Analyze Source Code: Detect the loops/functions of source code that consume the most time and memory.
- Tune for CPU, GPU & FPGA: Optimize for any supported hardware.
- Optimize Offload: Tune OpenMP*/SYCL offload performance.
- Wide Range of Performance Profiles: Parallelism, memory bottleneck, cache usage, core utilization, and more.
- Supported Languages: Includes most of the popular languages, e.g. SYCL, C, C++, Fortran, Python, Go, Java, or a mix.
Rich Set of Profiling Capabilities
Intel VTune Profiler helps design an efficient algorithm by:
- Locating the most time and memory-consuming part of your code.
- Locating microarchitecture bottlenecks and identifying the most significant hardware issues and memory-access related issues.
- Providing insights on how efficiently the code is threaded to increase parallelism.
- Reporting how effectively the hardware processes I/O traffic for I/O intensive workloads.
- Optimizing the offload schema and analyzing the code bottlenecks for accelerators.
Additionally, VTune assists with profiling the system behavior of longer-running applications. Figure-1 gives you a snapshot of all the workload performance aspects it touches on a given hardware platform.
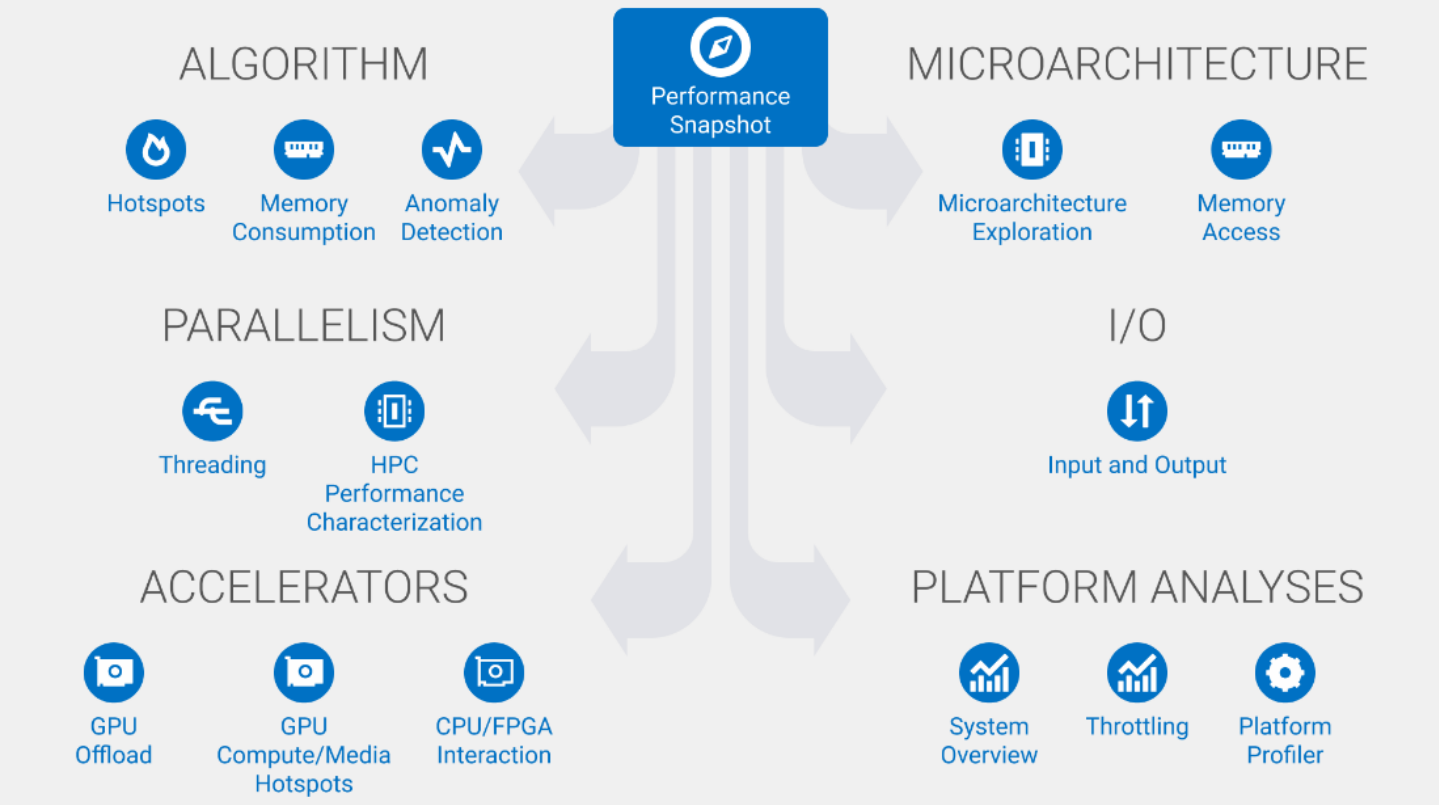
Figure-1: Platform Specific Workload Performance Characterization
As you can see, a complete performance profile for your workload can be established allowing you to determine exactly where to put your effort and how to take full advantage of your heterogeneous hardware setup.
Command Line Options
Here’s a quick overview of VTune’s command line usage:
- Run and Collect VTune Data
The common format of a VTune command line:
vtune -collect <collectionType> -knob <knobName=knobValue> -result-dir vtune_data [--] <targetApplication>
Other options: -search-dir=<string>, -source-search-dir=<string>, ...
Various types of profiling data can be collected like hotspots, memory-consumption, memory-access, threading... Various collection types specifically target GPU like gpu-hotspots, gpu-offload
Use the command line help to find out available collection types:
vtune --help collect
Use the command line to find out the supported knobs of a certain collection type:
vtune --help collect hotspots
- Generate HTML Report for Collected VTune Data:
vtune -report summary -result-dir vtune_data -format html -report-output $(pwd)/summary.html
Various types of report can be generated like summary, top-down, callstacks…
Use the command line help to find out more:
vtune --help report
- Download and View VTune Results
- Download the result folder from the server to your local machine
- Open VTune from the results folder file using VTune GUI
Let’s Get to It
Now it’s time to apply VTune to a SYCL open industry standard-based heterogeneous application with GPU offload. We will do the following:
- Analyze the application on a CPU and understand the nature of the workload.
- Analyze the application on a GPU and find the bottlenecks.
- Optimize the application step-by-step based on the reports generated by Intel VTune Profiler.
Example Workflow: VTune Profiling on CPU and GPU in 7 Steps
We will now build, run, collect data, and display the VTune summary when running on CPU and GPU.
Step 1: Test Application; SYCL Implementation of iso3dfd
The iso3dfd application is a three-dimensional stencil to simulate the wave propagation in a 3D isotropic medium. CPP and SYCL implementation of iso3dfd will be used to collect VTune data and analyze the generated result.
The following are the source code files of the iso3dfd application that will be profiled:
The example application will be invoked from the command line as follows:
./<executable_name> n1 n2 n3 Iterations
Here, n1 n2 n3: Defines the three-dimensional grid sizes for the stencil
Iterations: Number of timesteps to compute.
kernel_iterations: Number of cells, which one kernel iterates over - (only for 5_GPU_optimized binary)
n2_WGS n3_WGS: Work group size in second and third dimension (only for 5_GPU_optimized binary)
Step 2: Run Application on CPU
We start with a simple serialized CPP implementation of iso3dfd. We will run this application on CPU following 3 easy steps.
Command Line for Running the SYCL Implementation on CPU
First, we will write the commands to a file named run_iso3dfd.sh
%%writefile run_iso3dfd.sh
#!/bin/bash
source /opt/intel/inteloneapi/setvars.sh > /dev/null 2>&1
chmod -R 777 guided_iso3dfd_code_sample/build/src/1_CPU_only
./guided_iso3dfd_code_sample/build/src/1_CPU_only 256 256 256 100
After writing to run_iso3dfd.sh is complete, we will run the script:
! chmod 755 q; chmod 755 run_iso3dfd.sh; if [ -x "$(command -v qsub)" ]; then ./q run_iso3dfd.sh; else ./run_iso3dfd.sh; fi
VTune Profiler Command Line for Collecting and Reporting
Second, we will use VTune Profiler to determine whether the application is suitable for offloading to GPU, providing an assessment of offload improvement opportunities.
We will write the VTune command line to collect microarchitecture analysis and generate the summary report to a file named vtune_collect.sh:
%%writefile vtune_collect.sh
#!/bin/bash
source /opt/intel/inteloneapi/setvars.sh
type=uarch-exploration
echo "Vtune Collect $type"

vtune -collect uarch-exploration -knob collect-memory-bandwidth=true -search-dir=guided_iso3dfd_code_sample -source-search-dir=guided_iso3dfd_code_sample/build/src -result-dir vtune_data_CPU_uarch --  ./guided_iso3dfd_code_sample/build/src/1_CPU_only 256 256 256 100

echo "Vtune Summary Report"

vtune -report summary -result-dir vtune_data_CPU_uarch -format html -report-output $(pwd)/vtune_data_cpu_uarch.html
Run VTune to Collect GPU-offload Analysis and Generate Report
Third, after writing to the file is complete, we run the script:
! chmod 755 vtune_collect.sh; if [ -x "$(command -v qsub)" ]; then ./q vtune_collect.sh; else ./vtune_collect.sh; fi
Here are the snapshots of the Microarchitecture Exploration Analysis of the serialized CPP implementation on CPU:
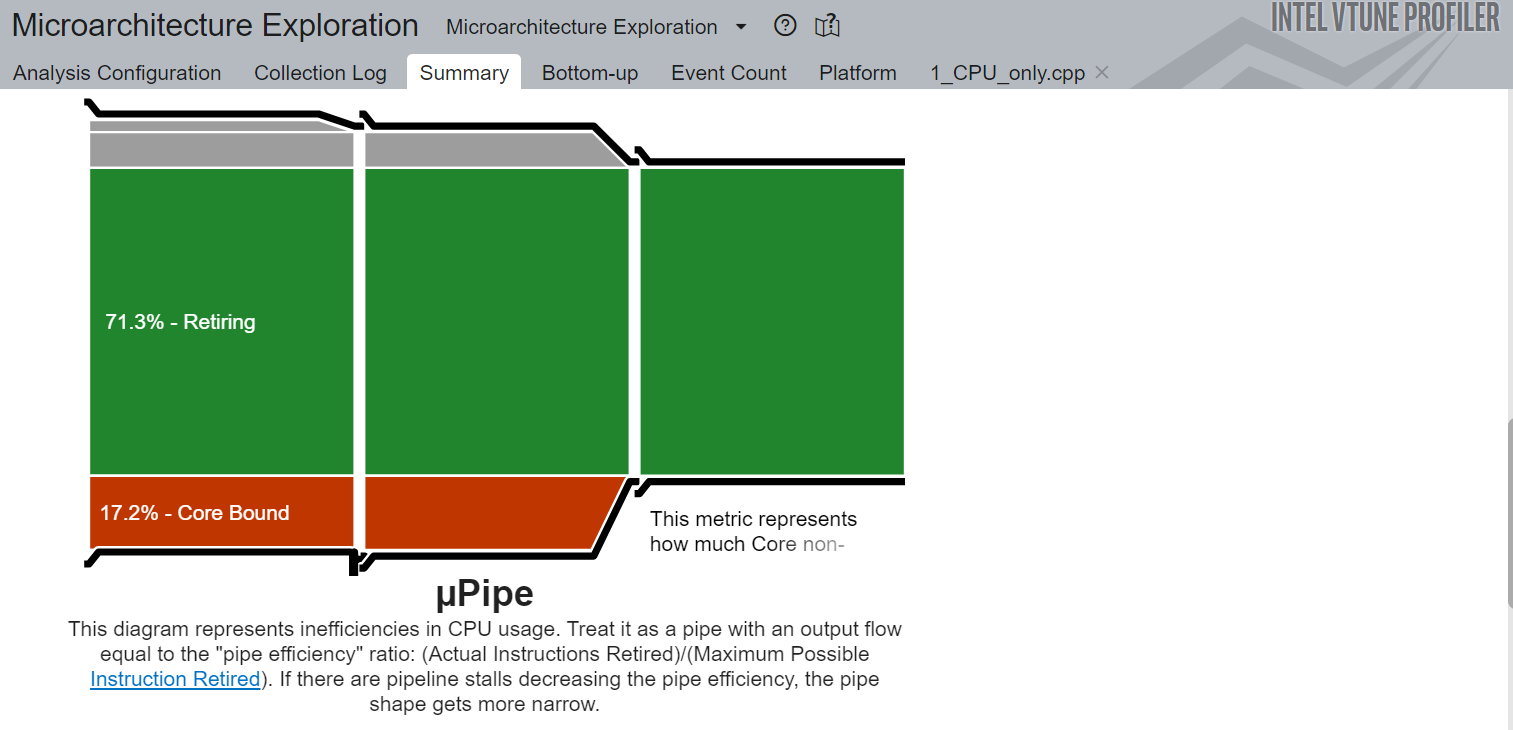
Figure-2: Micro-pipe diagram of Intel VTune Microarchitecture Exploration
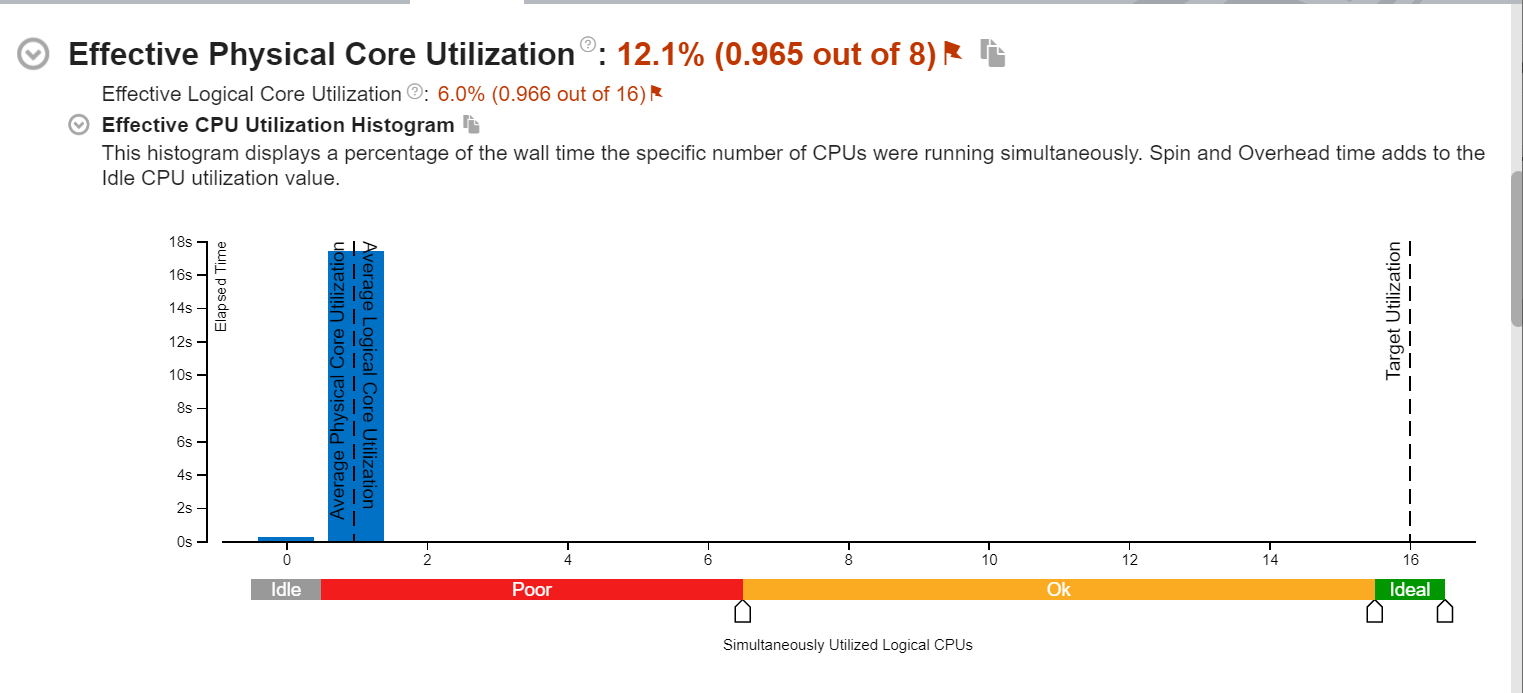
Figure-3: Effective physical core utilization histogram of Intel VTune Microarchitecture Exploration
The diagram in Figure-2 represents inefficiencies in CPU usage. It can be treated as a pipe with an output flow equal to “pipe-efficiency.” The gray region in this diagram is memory-bound, the green one is the retired instructions, and the red area is core-bound.
Figure-3 displays a histogram of the wall time the specific number of CPUs are running. As can be seen, the Effective CPU Utilization is quite low because the application is serialized.
Observations and Recommendations
- The application is core-bound (bottlenecks are non-memory)
- Low effective physical core utilization
- Requires multi-threaded parallel execution
- Requires more execution units
Step 3: Run and Sample Application Using GPU Offload
Now let us move our SYCL implementation of iso3dfd to be executed on a GPU. It will be run on the GPU without any specific optimization.
Again, we follow the 3 steps of:
- Setting up the command line for the application itself.
- Collecting and reporting on performance data.
- Generating the comprehensive performance report.
Changes made in code:
- Added SYCL buffers and accessors to code.
- Added Queue to offload kernels to GPU.
- Introduced SYCL kernel to compute the cells.
a) Command Line for Running the Basic SYCL Implementation on GPU
%%writefile run_iso3dfd.sh
#!/bin/bash
source /opt/intel/inteloneapi/setvars.sh > /dev/null 2>&1
chmod -R 777 guided_iso3dfd_code_sample/build/src/2_GPU_basic
./guided_iso3dfd_code_sample/build/src/2_GPU_basic 256 256 256 100
Overwriting run_iso3dfd.sh complete
! chmod 755 q; chmod 755 run_iso3dfd.sh; if [ -x "$(command -v qsub)" ]; then ./q run_iso3dfd.sh; else ./run_iso3dfd.sh; fi
b) VTune Command Line for Collecting and Reporting
Run VTune on the basic SYCL implementation on GPU, identify the bottlenecks and opportunities for improvement on GPU.
%%writefile vtune_collect.sh
#!/bin/bash
source /opt/intel/inteloneapi/setvars.sh
type=gpu-offload
echo "Vtune Collect $type"

vtune -collect gpu-offload -knob collect-programming-api=true -search-dir=guided_iso3dfd_code_sample -source-search-dir=guided_iso3dfd_code_sample/build/src -result-dir vtune_data_2_offload -- ./guided_iso3dfd_code_sample/build/src/2_GPU_basic 256 256 256 100

type=gpu-hotspots
echo "Vtune Collect $type"
vtune -collect gpu-hotspots -search-dir=guided_iso3dfd_code_sample -source-search-dir=guided_iso3dfd_code_sample/build/src -result-dir vtune_data_2_GPU_hotspots -- ./guided_iso3dfd_code_sample/build/src/2_GPU_basic 256 256 256 100
echo "Vtune Summary Report"

vtune -report summary -result-dir vtune_data_2_offload -format html -report-output $(pwd)/vtune_data_2_offload.html
c) Run VTune to Collect GPU-Offload Analysis and Generate Report
! chmod 755 vtune_collect.sh; if [ -x "$(command -v qsub)" ]; then ./q vtune_collect.sh; else ./vtune_collect.sh; fi
Here is a snapshot of GPU Oflload analysis of basic SYCL implementation run on GPU:
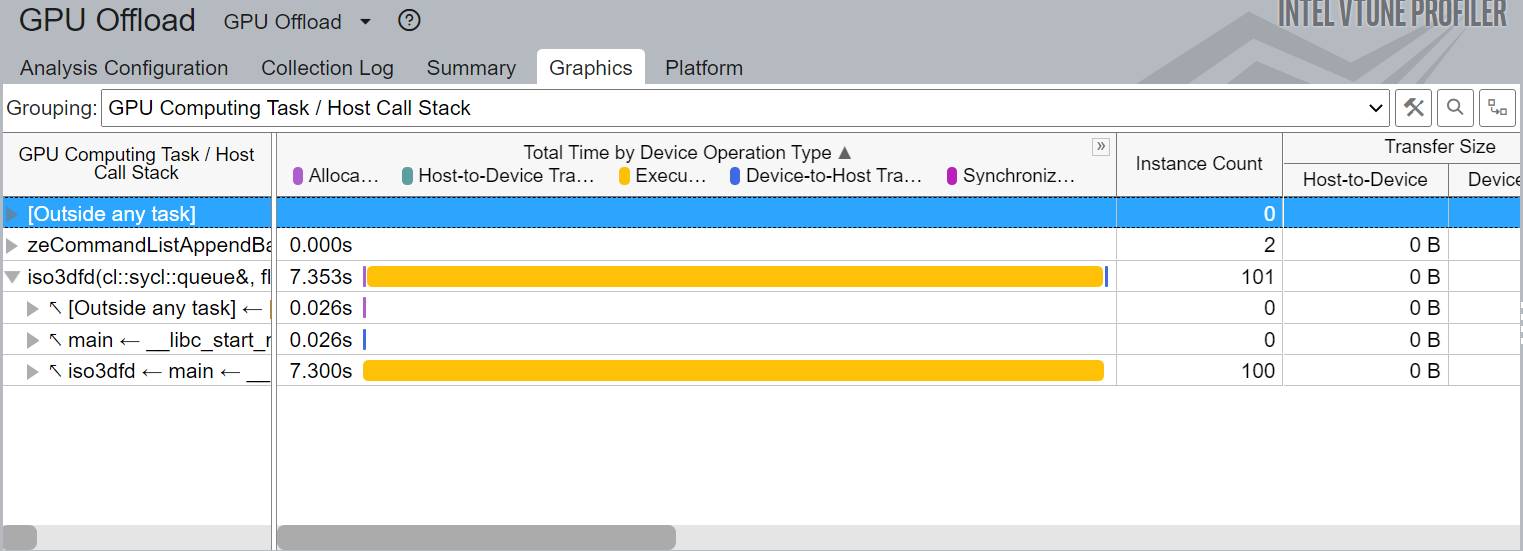
Figure-4: Graphics view of GPU Offload Analysis
We also ran the GPU Compute/Media Hotspots analysis of basic SYCL implementation on GPU:

Figure-5a: Bandwidth Utilization Histogram of GPU Compute/ Media Hotspots Summary View
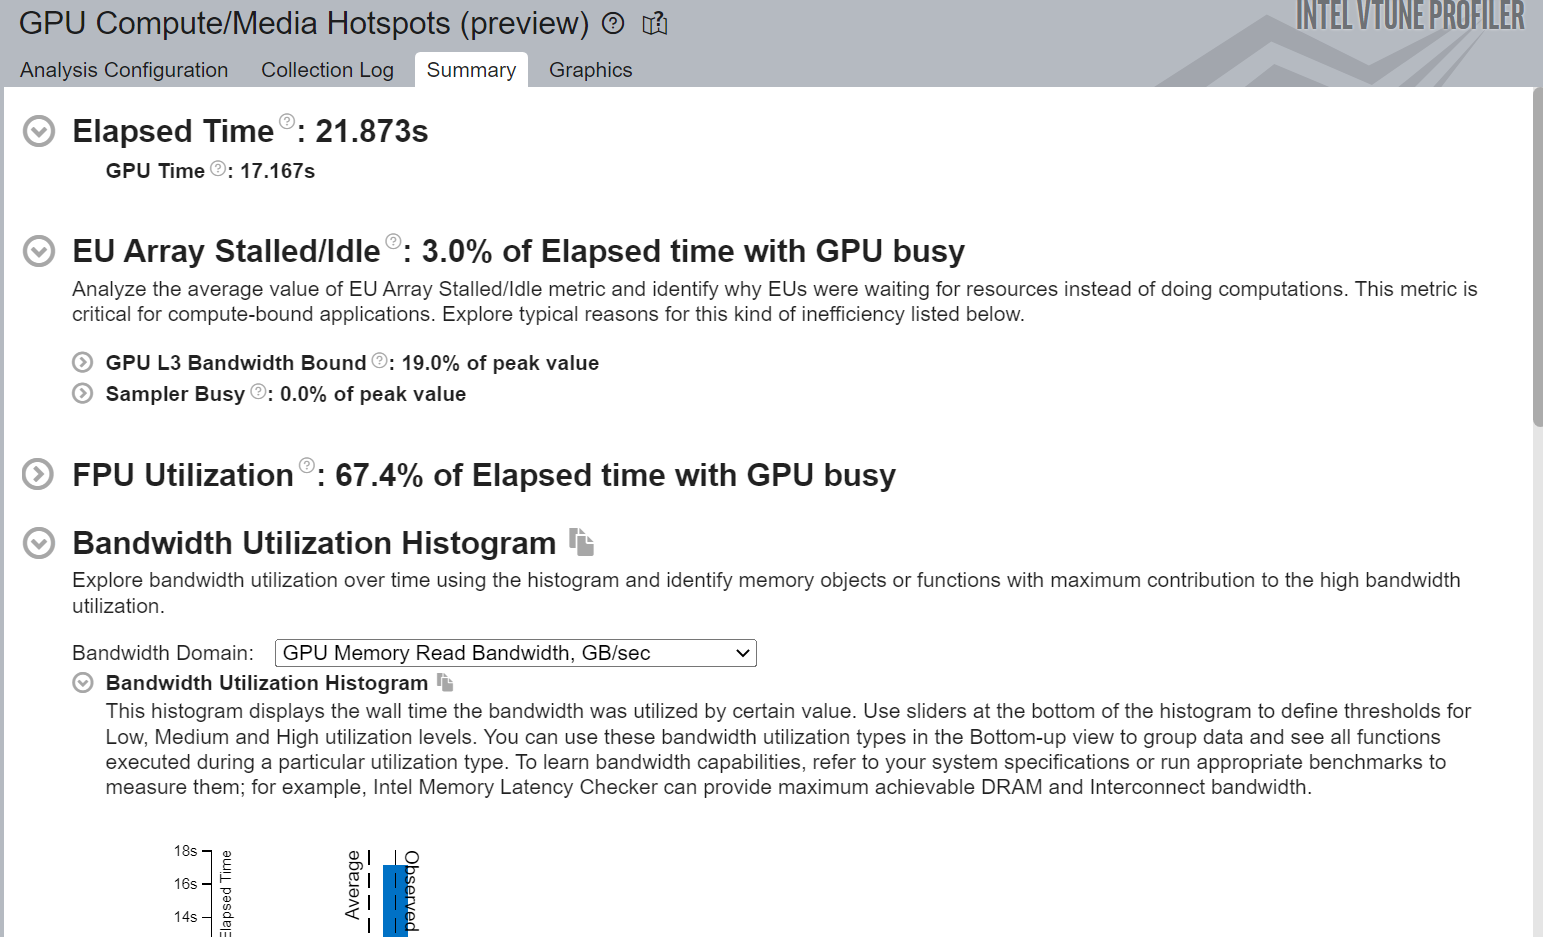
Figure-5b: Summary View of GPU Compute/ Media Hotspots
Figure-4 shows the breakdown of total time taken by each GPU compute task/host call stack.
Figure-5a shows the Bandwidth utilization histogram that displays the wall time the bandwidth was used by a certain value.
Figure-5b shows the Wall Time (Elapsed time) from the beginning to end of VTune collection.It also shows the time the application spent on GPU.
Observations and Recommendations
- Improvement in execution time
- Insignificant data transfer overhead
- Low Memory Bandwidth Utilization
- Reduce number of arithmetic operations
- Improve the memory bandwidth utilization
Step 4: GPU Optimization-1 (Linear Indexing)
Now let us apply the learnings from the GPU performance analysis and optimize execution on the GPU.
Based on the data we collected with our basic offload implementation, we improve indexing and convert it from 3-dimensional to 1-dimensional. This allows us to reduce the number of integer operations.
Code changes:
- Flatten the SYCL buffers
- Change the index calculation method
- Modify how neighbor cells are accessed
a) Command Line for Running the Linear Indexed SYCL Implementation on GPU
%%writefile run_iso3dfd.sh
#!/bin/bash
source /opt/intel/inteloneapi/setvars.sh > /dev/null 2>&1
chmod -R 777 guided_iso3dfd_code_sample/build/src/3_GPU_linear
./guided_iso3dfd_code_sample/build/src/3_GPU_linear 256 256 256 100
Overwriting run_iso3dfd.sh complete
! chmod 755 q; chmod 755 run_iso3dfd.sh; if [ -x "$(command -v qsub)" ]; then ./q run_iso3dfd.sh; else ./run_iso3dfd.sh; fi
b) VTune Command Line for Collecting and Reporting
%%writefile vtune_collect.sh
#!/bin/bash
source /opt/intel/inteloneapi/setvars.sh
type=gpu-hotspots
echo "Vtune Collect $type"

vtune -collect gpu-hotspots -search-dir=guided_iso3dfd_code_sample -source-search-dir=guided_iso3dfd_code_sample/build/src -result-dir vtune_data_3_GPU_hotspots -- ./guided_iso3dfd_code_sample/build/src/3_GPU_linear 256 256 256 100
c) Run VTune to Collect Hotspots and Generate Report
! chmod 755 vtune_collect.sh; if [ -x "$(command -v qsub)" ]; then ./q vtune_collect.sh; else ./vtune_collect.sh; fi
Here is a snapshot of GPU Compute/Media Hotspots analysis of SYCL linear indexing implementation on GPU:
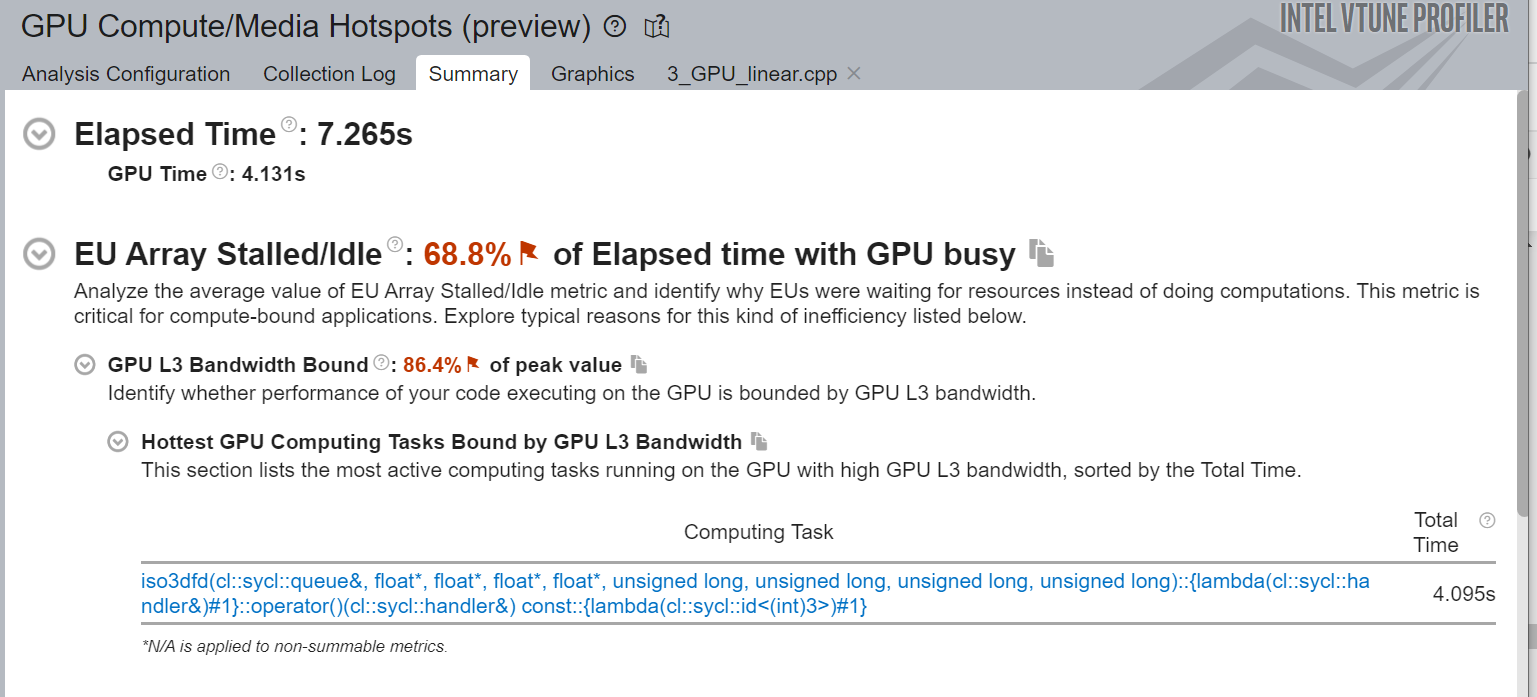
Figure-6: Summary view of GPU Compute/ Media Hotspots
Figure-6 shows high Execution Unit (EU) Stalled/Idle time. The typical reason for this inefficiency is that performance of the code on the GPU is bounded by GPU L3 bandwidth.
Observations and Recommendations
- 3x Improvement in elapsed time and 4x improvement in GPU time
- Moderate Memory Bandwidth Utilization
- High stall in Execution Unit (EU) arrays
- GPU L3 cache bandwidth-bound
- Break large structures into smaller arrays so that they can fit into registers
Step 5: Optimization-2_i (GPU Private Memory)
Continuing our optimization journey, we now introduce private arrays to the SYCL kernel to improve cache utilization.
Important code changes:
- Kernel range converted from 3d to 2d.
- Change in index calculation
- Add private arrays to contain coefficients
- Add loops to shift stencil data
a) Command Line for Running the SYCL Private Memory Implementation on GPU
%%writefile run_iso3dfd.sh
#!/bin/bash
source /opt/intel/inteloneapi/setvars.sh > /dev/null 2>&1
chmod -R 777 guided_iso3dfd_code_sample/build/src/4_GPU_private_memory_I
./guided_iso3dfd_code_sample/build/src/4_GPU_private_memory_I 256 256 256 10
Overwriting run_iso3dfd.sh complete
! chmod 755 q; chmod 755 run_iso3dfd.sh; if [ -x "$(command -v qsub)" ]; then ./q run_iso3dfd.sh; else ./run_iso3dfd.sh; fi
b) VTune Command Line for Collecting and Reporting
This is the command line for running gpu-hotspots on SYCL Private Memory implementation for GPU:
%%writefile vtune_collect.sh
#!/bin/bash
source /opt/intel/inteloneapi/setvars.sh
type=gpu-hotspots
echo "Vtune Collect $type"

vtune -collect gpu-hotspots -search-dir=guided_iso3dfd_code_sample -source-search-dir=guided_iso3dfd_code_sample/build/src -result-dir vtune_data_4_hotspots -- ./guided_iso3dfd_code_sample/build/src/4_GPU_private_memory_I 256 256 256 100
c) Run VTune to Collect Hotspots and Generate Report
! chmod 755 vtune_collect.sh; if [ -x "$(command -v qsub)" ]; then ./q vtune_collect.sh; else ./vtune_collect.sh; fi
Here is the GPU Compute/Media Hotspots analysis of SYCL implementation before adding private memory on GPU:
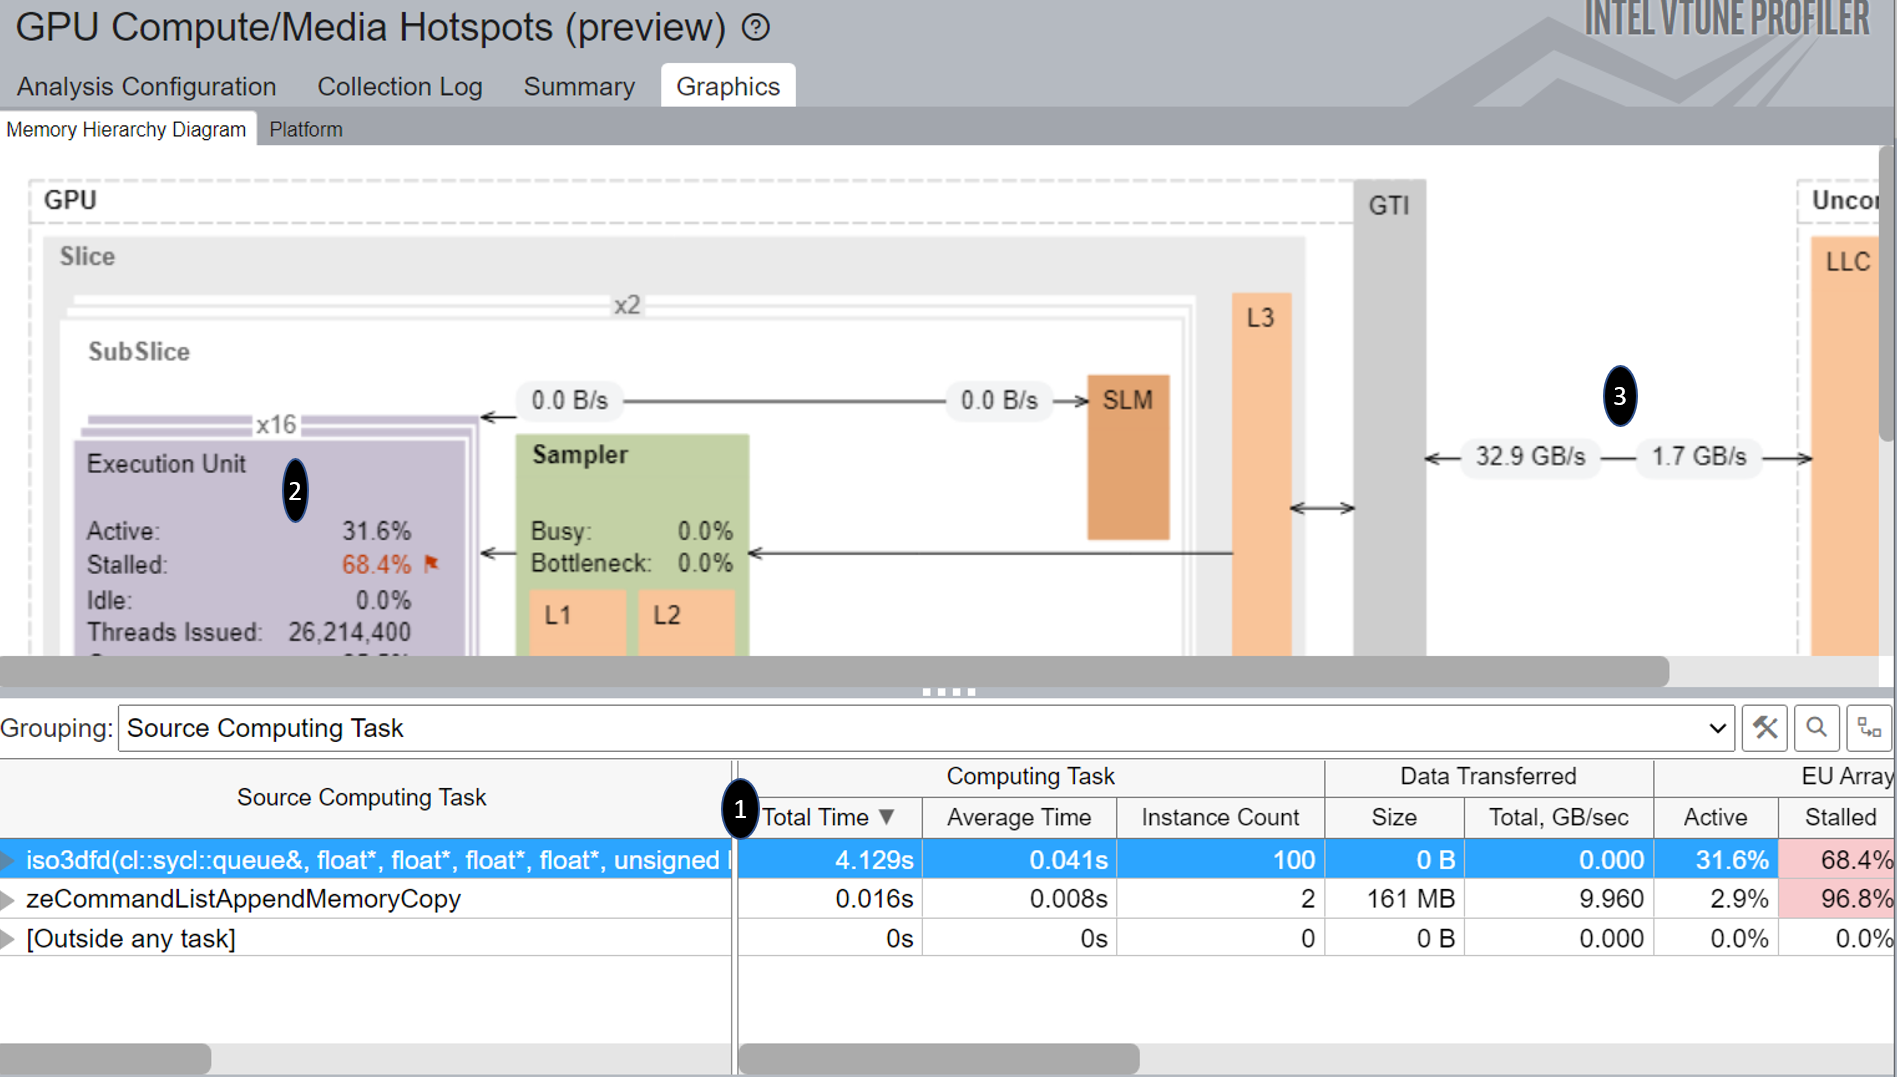
Figure-7: Graphics view of GPU Compute/Media Hotspots Analysis before adding Private Memory
And here is the GPU Compute/Media Hotspots analysis of SYCL implementation after adding private memory on GPU:
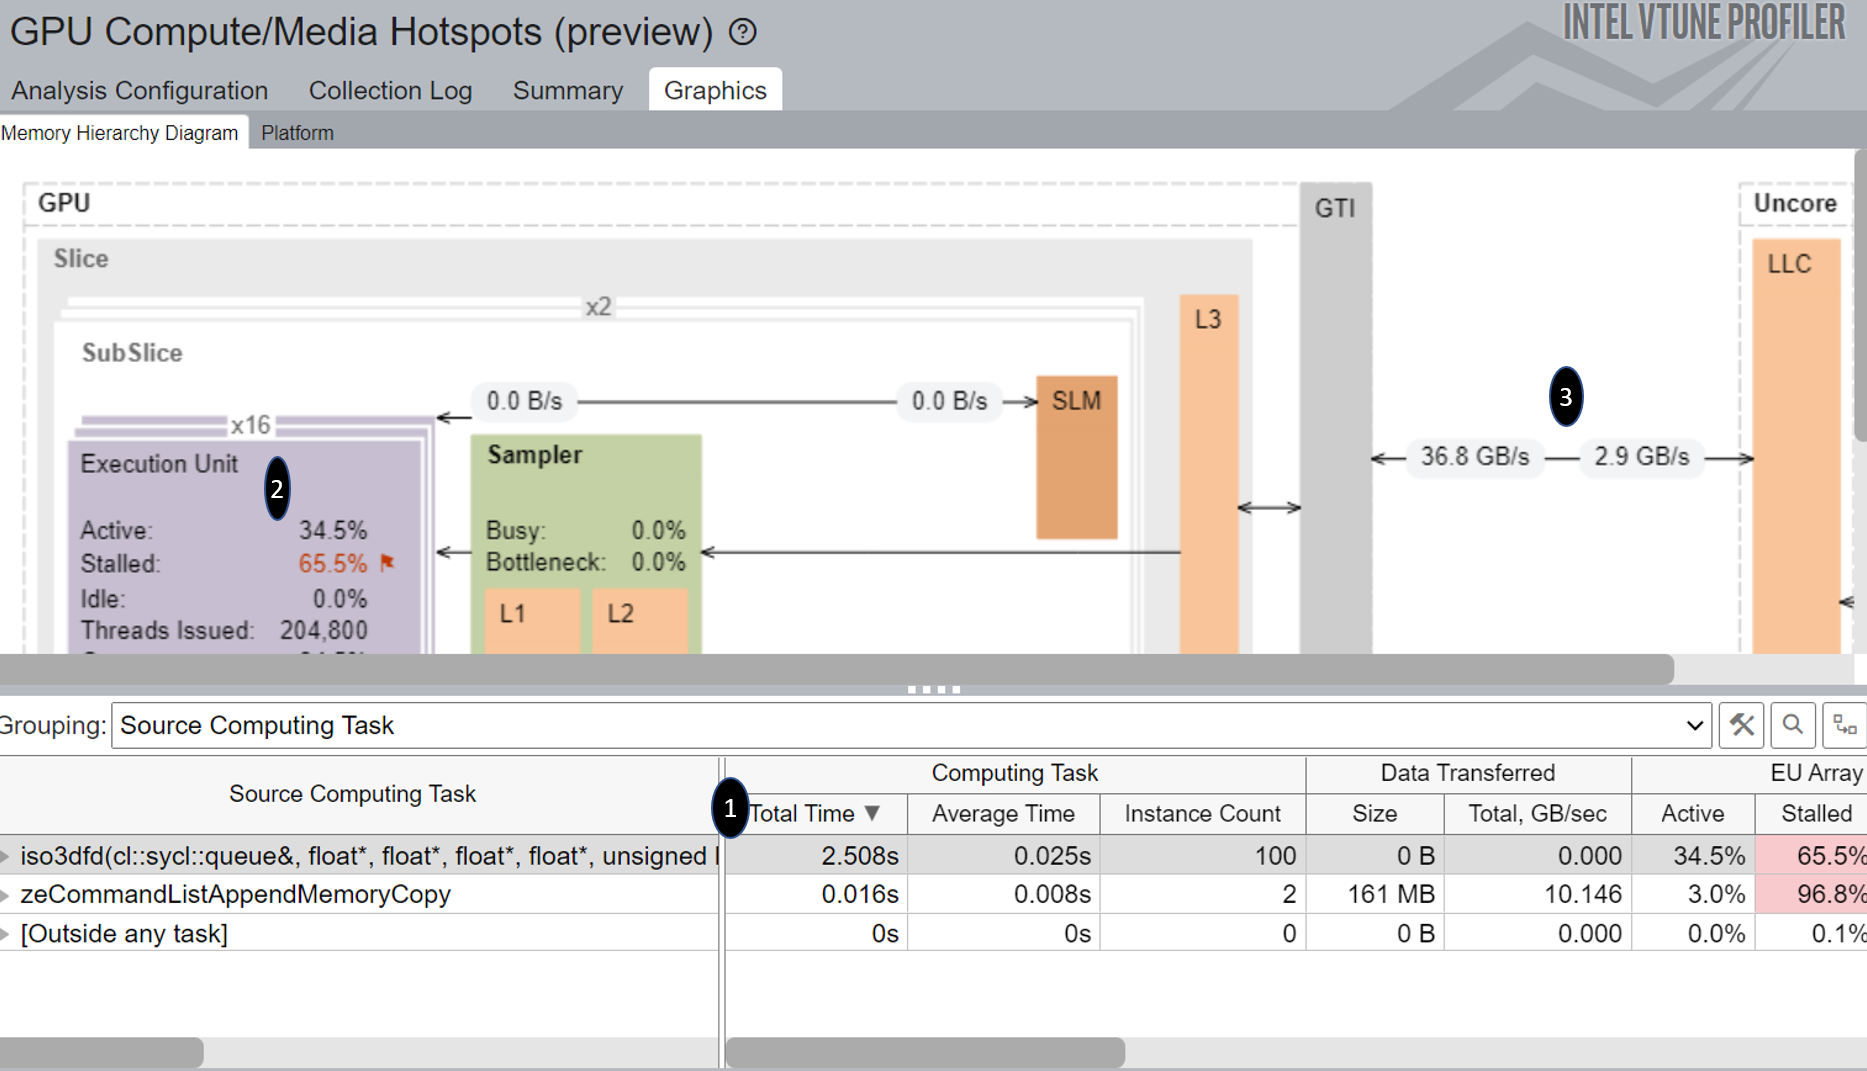
Figure-8a: Graphics view of GPU Compute/Media Hotspots Analysis after adding Private Memory
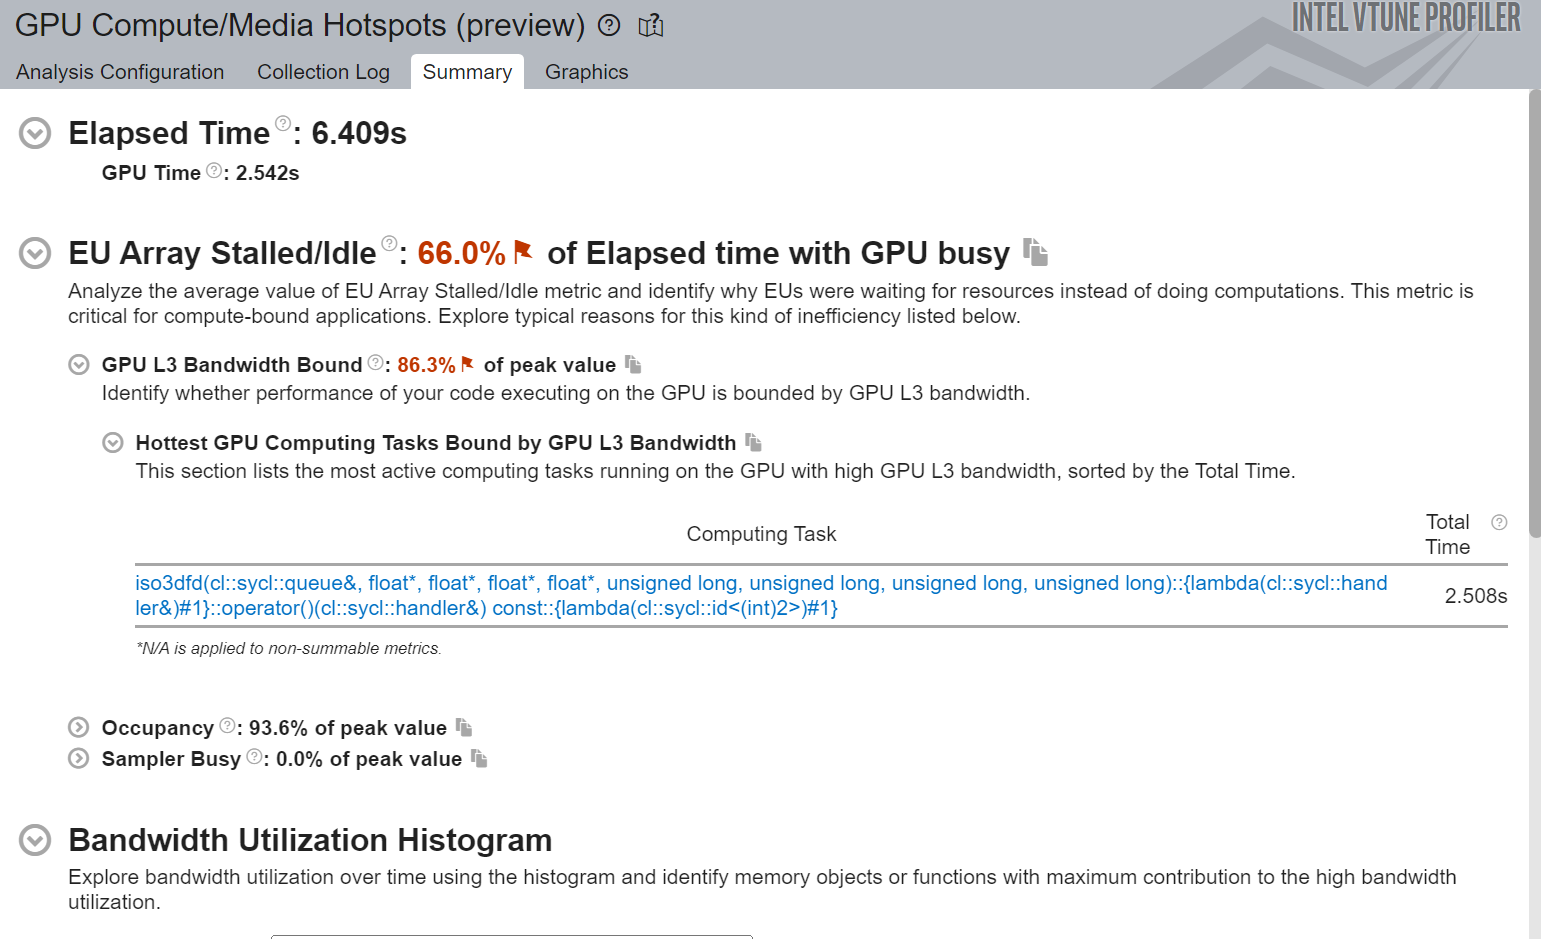
Figure-8b: Summary view of GPU Compute/Media Hotspots Analysis after adding Private Memory
If we compare Figure-7 ,Figure-8a and Figure-8b we can see:
- Significant difference in the total time of the top source computing task.
- Better ratio of EU Array Active time and Stalled time.
- Improvement in Read and Write bandwidth.
Observations and Recommendations:
- Reduced execution time
- Reduced EU stall time
- Higher EU active time
- Higher Read bandwidth in the kernel
- Still bounded by GPU L3 cache bandwidth
- Read each memory cell once and re-use the data
Step 6: Optimization-2_k (GPU Private Memory)
This optimization step is similar to the Optimization-2_i.
Here, we have created private arrays for the 3rd dimension, instead of first dimension.
a) Command Line for Running the SYCL Private Memory Implementation on GPU
%%writefile run_iso3dfd.sh
#!/bin/bash
source /opt/intel/inteloneapi/setvars.sh > /dev/null 2>&1
chmod -R 777 guided_iso3dfd_code_sample/build/src/4_GPU_private_memory_K
./guided_iso3dfd_code_sample/build/src/4_GPU_private_memory_K 256 256 256 100
Overwriting run_iso3dfd.sh
! chmod 755 q; chmod 755 run_iso3dfd.sh; if [ -x "$(command -v qsub)" ]; then ./q run_iso3dfd.sh; else ./run_iso3dfd.sh; fi
Step 7: Optimization-3 (Shared Local Memory)
In this step, we will introduce Shared Local Memory and nd_range kernel to overcome the memory constraint issue.
Code changes:
- Change back the kernel_range to 3d
- Introduction of the local index corresponding to the position in SLM
- Add barriers to ensure synchronization
- Tweak work group size
a) Command Line for Running the SYCL Shared Local Memory Implementation on GPU
%%writefile run_iso3dfd.sh
#!/bin/bash
source /opt/intel/inteloneapi/setvars.sh > /dev/null 2>&1

chmod -R 777 guided_iso3dfd_code_sample/build/src/5_GPU_optimized
./guided_iso3dfd_code_sample/build/src/5_GPU_optimized 256 256 256 100 16 8 16
Overwriting run_iso3dfd.sh complete
! chmod 755 q; chmod 755 run_iso3dfd.sh; if [ -x "$(command -v qsub)" ]; then ./q run_iso3dfd.sh; else ./run_iso3dfd.sh; fi
b) VTune Command Line for Collecting and Reporting
This is the command line for running gpu-hotspots on SYCL Shared Local Memory implementation for GPU:
%%writefile vtune_collect.sh
#!/bin/bash
source /opt/intel/inteloneapi/setvars.sh
type=gpu-hotspots
echo "Vtune Collect $type"

vtune -collect gpu-hotspots -search-dir=guided_iso3dfd_code_sample -source-search-dir=guided_iso3dfd_code_sample/build/src -result-dir vtune_data_5_hotspots_tuned -- ./guided_iso3dfd_code_sample/build/src/5_GPU_optimized 256 256 256 100 16 8 16
c) Run VTune to Collect Hotspots and Generate Report
! chmod 755 vtune_collect.sh; if [ -x "$(command -v qsub)" ]; then ./q vtune_collect.sh; else ./vtune_collect.sh; fi
Here is a snapshot of the GPU Compute/Media Hotpots analysis after adding Shared Local Memory:
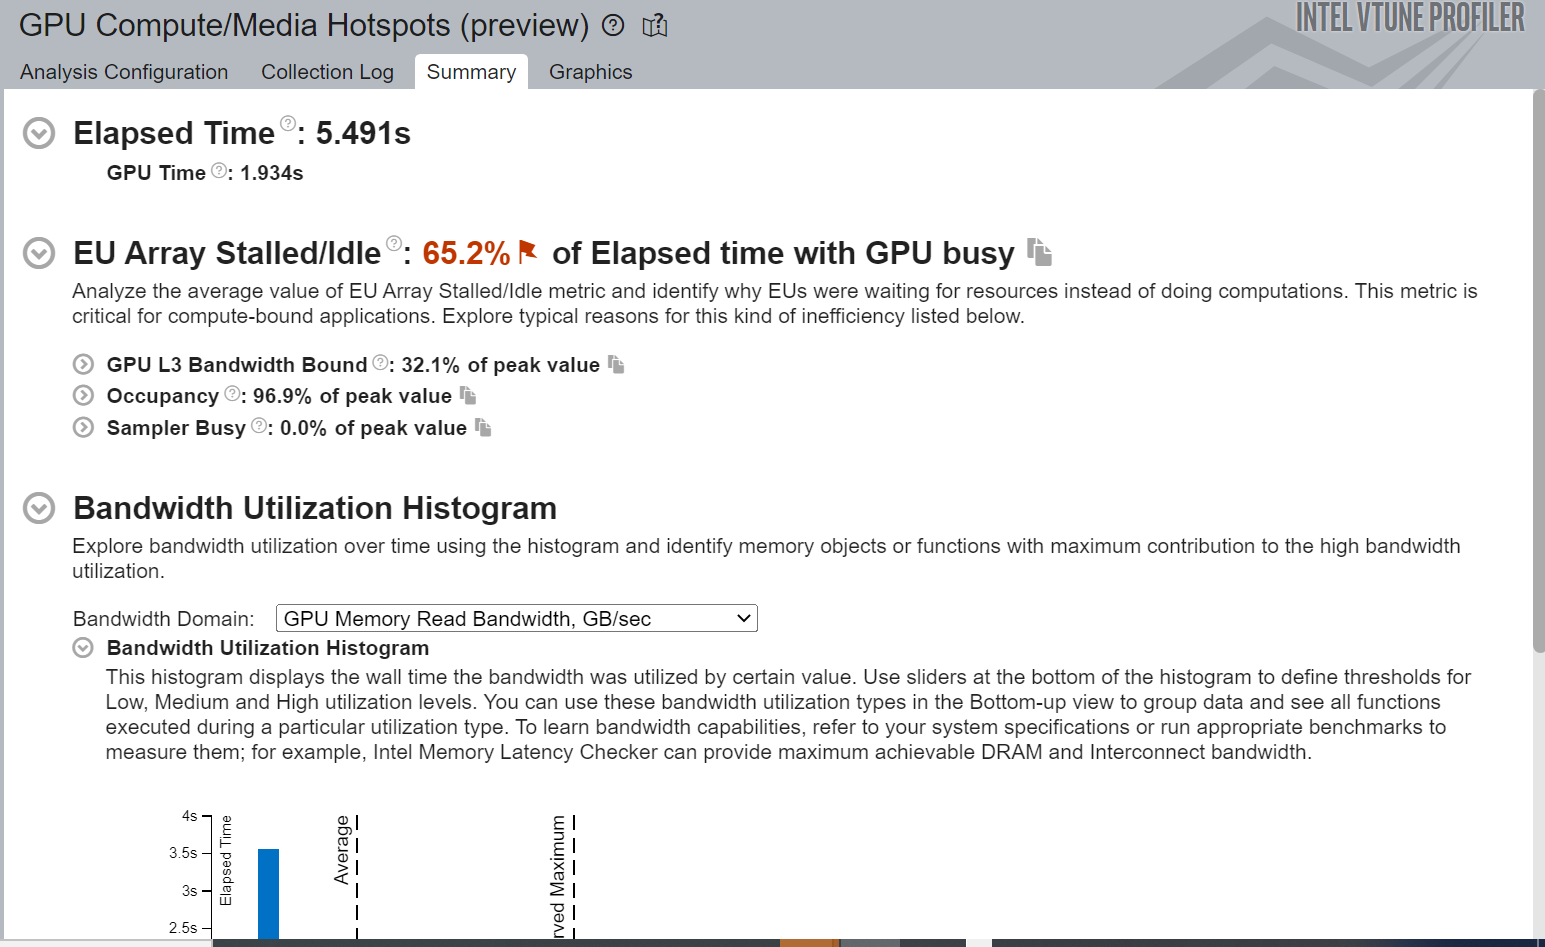
Figure-9: Summary view of GPU Compute/Media Hotspots Analysis
From Figure-9 we can see the improved EU Array Stalled/Idle time. It also shows significant improvement in total GPU time and reduced time spent in the hottest GPU computing task.
Observations and Recommendations:
- Improvement in execution time
- Better utilization of EU arrays
- Increase in the memory read and write bandwidth
Summary
Intel VTune Profiler is a very powerful tool for in-depth analysis of a real-world application to locate performance bottlenecks on CPU as well as GPU. Our overall improvements of the SYCL implementations on GPU throughout the journey are summarized in Table 1 below.
|
|
Step 3 |
Step 4 |
Step 5 & 6 |
Step-7 |
|---|---|---|---|---|
|
GPU Optimization Type |
Basic GPU Offload |
GPU Optimization-1 (Linear Indexing) |
Optimization 2_i: GPU Private Memory – 1st Dimension |
Optimization 3: Shared Local Memory |
|
Wall Time(s) |
21.873 |
7.265 |
6.409 |
5.491 |
|
GPU Time (s) |
17.167 |
4.131 |
2.542 |
1.934 |
Our CPU- and GPU-optimization journey showcased the tremendous performance improvements that can be achieved by translating the advice of the Intel VTune™ Profiler into action.
Learn More
- Check out the Intel® Innovation 2022 session recap for additional background: Code Design and Optimization for Next Generation CPUs and Compute Accelerators with oneAPI Analysis Tools
- Intel® oneAPI Components - Putting the Needs of Developers First
- Intel® Advisor - Design Code for Efficient Vectorization, Threading, Memory Usage, and Accelerator Offloading
Get the Software
Download Intel VTune Profiler standalone or as part of the Intel® oneAPI Base Toolkit, a core set of tools and libraries for developing performant, data-centric applications across CPUs, GPUs, FPGAs, and other accelerators.