This page provides the older Release Notes' for Intel® VTune™ Profiler (starting with Intel® VTune™ Amplifier XE 2017). The notes are categorized by major version, from newest to oldest, with individual releases listed within each version section.
Refer to latest Release notes Page of the most recent version of Intel® VTune™ Profiler.
NOTE: Intel® VTune™ Amplifier has been renamed to Intel® VTune™ Profiler starting with version 2020.
Click a release to expand it into a summary of new features and changes in that version since the last release. The expanded summary also contains download buttons for the detailed release notes, which include important information, such as pre-requisites, software compatibility, installation instructions, and known issues.
You can copy a link to a specific release's section by clicking the chain icon next to its name.
The installation guides are posted separately.
View Installation Guide
All files are in PDF format - Adobe Reader* (or compatible) required.
To get product updates, log in to the Intel® Software Development Products Registration Center.
For questions or technical support, visit Intel® Software Developer Support.
2024
New in the Release
New Language Support
- Added support for Python 3.11
New Hardware Support
- ARL-S
- MTL-P
Intel® Core™ Ultra 200V Support
- Added support for Intel® Core™ Ultra 200V, previously codenamed Lunar Lake and next-gen Intel(R) Arc(TM) Graphics, codenamed Battlemage
Technical Preview Feature: New "Bottlenecks View"
- Get a high-level view of potential bottlenecks in software performance analysis before exploring top-down microarchitecture metrics for deeper analysis
- Currently supports 5th Gen Intel® Xeon® processors (code-named Emerald Rapids), 4th Gen Intel® Xeon® Scalable processors (code-named Sapphire Rapids), and the Intel® Xeon® CPU Max Series (code-named Sapphire Rapids HBM).
oneCCL in Application Performance Snapshot
- Get insights into sub-optimal oneCCL communication in your applications by finding out the time spent in oneCCL calls and identifying most active oneCCL communication tasks in your application.
oneCCL in GPU and HPC-PC Analysis
- View the top CCL function
.NET8 Support for new Intel Architectures
- Added support for .NET 8 and new Intel architectures code named Sierra Forest and Grand Ridge.
GPU Support
- Improved finalization time for collecting GPU HW metrics for a specific tile.
Overview
This version of Intel® VTune™ Profiler contains improvements and additions in the following areas:
USM Collector Component
- Identify and understand the reasons of implicit Unified Shared Memory data movements between Host and GPU causing performance inefficiencies in SYCL applications.
- Correlate the data transfers with compute tasks execution on GPU.
- Currently supporting SYCL applications running on Intel® Data Center GPU Max Series on Linux.
.NET8 Support
- Enabled .8NET Support
OS Support
- Ubuntu 23.10 Support
- FreeBSD 14
Intel® VTune™ Profiler - Platform Profiler Transition
- Platform Profiler capabilities in Intel® VTune™ Profiler will be transitioned to the EMON command line interface.
- Starting with Intel VTune Profiler 2024.0 release, the Platform Profiler feature will become a separate download and will be discontinued in a later release.
Discontinued 32-bit Support for Intel® Analyzers
-
32-bit support for Intel® Analyzers will be discontinued in 2024.2 release.
Intel® Data Center Max 1100C GPU
- A 300-watt double-wide AIC card with 56 Xe cores and 48 GB of HBM2E memory. Multiple cards can be connected via Intel Xe Link bridges. This card is specifically designed to meet the requirements of US Government Export Control Regulations for export into China.
Application Performance Snapshot
- Xe Link observability
Added two Xe Link related metrics to APS summary with average cross-GPU traffic bandwidth through Xe Links. It shows the average value per-node/per-gpu. It is also possible to get the value through CLI metrics report attributed to the device.
Hardware Support
- Support for 5th Gen Intel® Xeon® Server Processors (code named Emerald Rapids)
Includes I/O analysis support
Enabled Platform Diagram
OS Support
- Fedora* 38 and 39
- Ubuntu* 23.04
- SUSE* Linux* Enterprise Server (SLES) 15 SP5
- Windows* 11 23H2
Known Issues
- VTUNE 2024.2 DISPLAYS INCORRECT "INSTANCE COUNT" FOR GPU-OFFLOAD ANALYSIS (VASP-31110) This only affects the value for "instance count" in the Bottom-Up view for GPU Computing Tasks. The "instance count" in the GPU Compute/Media Hotspots is correct.
- VTUNE 2024.1 REQUIRES LIBCRYPT.SO.1 INSTALLATION TO RUN APPLICATIONS
- VTUNE 2024.1 IT IS RECOMMENDED TO USE THE LATEST TESTED NPU DRIVER TO RUN "NPU EXPLORATION (PREVIEW)" ON INTEL® CORE™ ULTRA PROCESSORS SERIES 1 (FORMERLY METEOR LAKE) It is recommended to run "NPU Exploration (preview)" on Intel® Core™ Ultra processors Series 1 (formerly Meteor Lake) with the latest tested NPU driver version 32.0.100.2222, note that DDR bandwidth metrics may not be displayed in "Time-based" collection mode. The last NPU driver version where DDR bandwidth metrics work correct in "Time-based" collection mode is 31.0.100.2055. NPU Exploration (preview) analysis type doesn't support Windows 11 Version 24H2 Insider Preview
- VTUNE 2024.1 MAY HAVE INCORRECT WINDOWS VERSION SHOWN ON SUMMARY TAB (VASP-20172) VTune Profiler may show incorrect Windows version in Collection and Platform Info section on Summary Tab
-
VTUNE PROFILER 2024.0 IS INCOMPATIBLE WITH glibc 2.37-13 ON FEDORA OS
-
VTUNE PROFILER 2024.0 PREVIOUSLY COLLECTED PLATFORM PROFILER RESULTS CANNOT BE OPENED WITH VTUNE GUI DUE TO SEPARATION FROM VTUNE PACKAGE
Results previously collected with VTune Platform Profiler (VPP) can no longer be opened in the VTune GUI as the platform profiler has been separated from the primary VTune product.
-
VTUNE PROFILER 2024.0 MODULEFILE INCORRECTLY DERIVES COMPONENT ROOT PATH AS "/"
The modulefile included with VTune Profiler 2024.0 incorrectly derives the component root path as "/". This file is located at:<install-dir>/vtune/2024.0/etc/modulefiles/vtune/2024.0
Workarounds for this issue include:1. Click here to download the fixed tcl file and replace the existing 2024.0 file.
2. Instead of using "module load" to set up the environment variables, run:
$ source <install-dir>/vtune/latest/vtune-vars.sh
-
VTUNE PROFILER 2024.0 HBM AND TMA METRIC LIMITATION (DOC-11651)
The HBM Bound metric (in Microarchitecture Exploration, Memory Access, and HPC Performance Characterization) is only functional in HBM cache mode. The metric may not show a proper value in the HBM only and HBM flat modes.
2023
New in the Release
Release
Overview
This version of Intel® VTune™ Profiler contains improvements and additions in the following areas:
GPU Accelerators
- Better Hardware observability in the Platform Diagram.
Identify Intel® Data Center GPU Max Series (formerly codenamed Ponte Vecchio) observability in the platform diagram.
Application Performance Snapshot
- Analyze the performance utilization of a particular GPU in the stack using Application Performance Snapshot.
For each GPU, get insights into how much time is used for offload tasks and how the execution units are utilized.
Language Support
- Support for New Language Versions
This release introduces support for Python 3.10.* in the Hotspots Analysis type for Windows and Linux systems.
Explore performance analysis for .NET7 applications or native applications with .NET calls.
Intel® VTune™ Profiler - Platform Profiler
- Starting with the 2023.2 release, the Intel® VTune™ Profiler - Platform Profiler is available as a standalone application only.
The Platform Profiler analysis will no longer be available through the VTune Profiler GUI or command line. You can still collect platform behavior data by running the standalone application: https://www.intel.com/content/www/us/en/docs/vtune-profiler/user-guide/current/platform-analysis.html. The data collected with the Platform Profiler collector can be visualized with the Platform Profiler server.
Hardware Support
- Better Hardware observability in the Platform Diagram
Identify average HBM bandwidth on Intel® Xeon® Max Series CPUs (code named Sapphire Rapids HBM) in the platform diagram separately from DRAM bandwidth.
Usability
- Intel VTune Profiler now allows for filtering kernels by name.
This is especially useful for applications that has many kernels, such as Gromacs, LAMPS etc. - GPU Adapter names will be replaced by short GPU Aliases.
- GPU Adapter names will be replaced by aliases in Summary, Grid and Timeline
- Collection and Platform Info section will contain full names for GPU adapters, their BDFs and aliases.
- The aliases will be stable: the same GPU adapters will have the same aliases for all results that are collected on the machine.
- The alias should have the following format: "GPU 0", "GPU 1", "GPU N"
Release
GPU Accelerators
- Support XeLink cross-card traffic profiling
Get visibility into XeLink cross-card traffic for issues such as stack-to-stack traffic, throughput and bandwidth bottlenecks. Identify imbalances of traffic between CPU and GPU through a GPU topology diagram.
Debug Support
- Support for Large PDB Files
Starting with the 2023.1 version, on Windows* systems, you can resolve debug information from PDB files larger than 4GB.
OS Support
- Support Windows* 10 22H2 and Windows 11 22H2.
- Intel® VTune Profiler for macOS is now deprecated and will be discontinued in a future release. Learn other options to view results on macOS.
Hardware Support
- Support for New Architectures
VTune Profiler now supports the following generations of processors in client and server platforms:- Intel® Xeon® Max Series CPUs (code named Sapphire Rapids HBM)
- Identify performance gained from HBM. Run Intel® VTune Profiler for each mode (HBM only, Flat, Cache) to identify which profile offers the best performance.
- Intel® Xeon® Max Series CPUs (code named Sapphire Rapids HBM)
GPU Accelerators
- Stall Factor Information in GPU Profiling Results
When you run the GPU Compute/Media Hotspots analysis to profile applications running on Intel® Data Center GPU Max Series (code named Ponte Vecchio) devices, you can now see the reasons for stalls in Xe Vector Engines (XVEs), formerly known as Execution Units (EUs). Use this information to better understand and resolve the stalls in your busiest computing tasks. For more information, see Analyze Xe Vector Engine (XVE) Stalls. - Metric Groups for Multiple GPUs
When you run the GPU Compute/Media Hotspots analysis to profile an application executing on multiple Intel GPUs, you can now see metric information grouped by Intel microarchitecture family. See metrics for every GPU architecture family in a new consolidated view. To learn more, see Analysis Results for Multiple GPUs. - Updated Metrics for Multiple GPUs
GPU metric information in the Summary tab of the HPC Performance Characterization View have been enhanced to better represent data collected from multiple GPUs.
Application Performance Snapshot
- Updated Metrics for Multiple GPUs
GPU metric information in the Application Performance Snapshot HTML reports have been enhanced to better represent data collected from multiple GPUs.
Language Support
- Support for New Language Versions
This release introduces support for Python 3.9.0 in the Hotspots Analysis type for Windows and Linux systems.
Platform Support
- Support for Legacy Processors
VTune Profiler now supports the following generations of processors in client and server platforms:- Server CPUs: Intel® Xeon® processor v3 and newer families.
- Client CPUs: Intel® Core™ 4th generation processors and newer families.
The 2023 version of VTune Profiler does not support processors older than the versions listed above. To analyze performance on older processors, use an older version of VTune Profiler.
Hardware Support
- Support for New Architectures
VTune Profiler now supports the following generations of processors in client and server platforms:- Fourth generation of Intel® Xeon® Scalable Processor (code named Sapphire Rapids)
- 13th generation of Intel® Core™ Processor (code named Raptor Lake)
- Intel® Data Center GPU Max Series (code named Ponte Vecchio)
- First generation of Intel® Arc™ High-performance Discrete GPUs (code named Alchemist). This support includes:
- Explicit support for SYCL, DirectX, Intel® Media SDK, OpenCL™, and OpenMP offload software technologies.
- Support for multi-GPU systems. You can now profile all Intel GPU devices, including integrated and discrete GPUs.
- Support for GPU Offload and GPU Hotspots analyses, including source level in-kernel profiling.
Known Issues
- VTUNE PROFILER 2023.2 KERNEL PANIC WHEN RUNNING HARDWARE-BASED SAMPLING COLLECTIONS ON FEDORA DISTRIBUTIONS RUNNING LINUX KERNEL VERSION 5.17 OR LATER (VASP-29437)
For some hardware-based analysis types, particularly Memory Access and Microarchitecture Exploration, VTune may cause a kernel panic on systems with Fedora distributions running Linux kernel version 5.17 or later. This has been fixed for the upcoming release. To work around this problem, unload the VTune sep driver by running:
$ sudo <VTune install dir>\latest\sepdk\src\rmmod-sep
This will prevent VTune from using the problematic driver and use Linux Perf instead. - VTUNE PROFILER 2023.2 GPU ANALYSIS MAY FAIL WITH INTEL DATA CENTER GPU MAX SERIES (CODE NAME PONTE VECCHIO) With the recent GPU software stack (starting with agama-ci-devel-679 and newer) some VTune 2023.2 GPU analyses may fail with Intel® Data Center GPU Max Series (PVC). Affected analysis types are: GPU Offload analysis and GPU Compute\Media Hotspots analysis in "Compute Basic" mode.
Corresponding command lines for the analyses:
vtune -collect gpu-offload (default mode)
vtune -collect gpu-hotspots -knob characterization-mode=global-local-accesses (non-default mode)
The displayed error message would be the following:
vtune: Warning: Cannot start collection of GPU events
vtune: Collection failed
vtune: Internal Error
To avoid the failure, a user should remove or comment out lines #38 and #39 in VTune configuration script: <VTUNE_INSTALL_DIR>/config/analysis_type/include/gpu_metric_sets.xsl:
<item>HOST_TO_GPUMEM_BYTE_READ</item>
<item>HOST_TO_GPUMEM_BYTE_WRITE</item>
It is recommended to save the original script in the same directory and restart the VTune GUI if it's running on a target machine. - VTUNE PROFILER 2023.2 PLATFORM PROFILER DOESN'T SUPPORT 12TH GEN INTEL CORE PROCESSORS (CODE NAMES ALDER LAKE AND RAPTOR LAKE) (VASP-29214)
- VTUNE PROFILER 2023.2 IMPORTING PLATFORM PROFILER DATA FROM 8th GEN INTEL CORE PROCESSORS (CODE NAME COFFEE LAKE) FAILS WITH THE PLATFORM PROFILER SERVER (VASP-29198)
This is one known issue on 2023.2, may be fixed in future release.- Importing valid result data into the Platform Profiler server (both on Linux and on Windows 11) fails with no obvious error message to the user.
- Server log contains the following message: Load failed on dataset. Dataset has no emon_results_metrics file and no formula file.
- VTUNE PROFILER 2023.2 EMON DATA IS NOT PROPERLY LOADED ON HYBRID PLATFORMS (DOC-11343)This is one known issue on 2023.2, will be fixed in future release. A workaround is available.
VTune does not load EMON data properly from hybrid system where events are not applicable to both core types.- The issue is currently observed on Windows OS only and not reproduced on Linux.
- The Performance Snapshot and Microarchitecture Exploration analysis types in summary mode are impacted.
As a workaround, run the collection in the command line with the following option: --run-pass-through=--aggregated-counting
For example, to run the Performance Snapshot analysis on the matrix sample, run: > vtune -collect performance-snapshot --run-pass-through=-aggregated-counting -- matrix.exe
- VTUNE PROFILER 2023.2 MAX DRAM BANDWIDTH ESTIMATION MAY BE CALCULATED INCORRECTLY ON PLATFORMS WITH HBM (VASP-29158) The estimation of max DRAM bandwidth value is incorrect on platforms with HBM in flat mode.
- VTUNE PROFILER 2023.1 USER MODE SAMPLING FAILS WITH APPLICATION LINKED WITH GLIBC 2.35 (VASP-28157) This is one known issue on 2023.1, will be fixed in future release.
- Hotspots and threading user mode sampling and memory access / consumption, and I/O analysis types with sep sampling will fail when application is linked with glibc 2.35 on Ubuntu 22.04.
- All cases using Perf and VTSS succeed with this application.
- Other than the I/O, Memory Access, and Memory Consumption, all cases using SEP also succeed.
- VTUNE PROFILER 2023.1 HARDWARE EVENT-BASED SAMPLING FAILS *PATCH AVAILABLE* (VASP-28956) This is a known issue in the SEP driver packaged with update 2023.1, and will be fixed in a future release. The problem was reported on SLES15 SP4 but could happen on other Linux distros. A standalone SEP patch with the fix is available here: https://www.intel.com/content/www/us/en/developer/articles/code-sample/vtune-profiler-sampling-driver-downloads.html
On certain workloads, the issue is seen after the 3rd or 4th runs, and on some systems it is observed in the 1st or 2nd run. One of the following behaviors is observed randomly with each failure:- making the system go unresponsive and rebooting
- system hangs in between
- aborts the workload in the middle of collection and exits VTune
2022
Overview
Intel® VTune Profiler 2022.4.1 has been updated to include functional and security updates. Users should update to the latest version as it becomes available.
Overview
This version of Intel® VTune™ Profiler contains improvements and additions in these areas:
- Several critical bugs were fixed
Overview
This version of Intel® VTune™ Profiler contains improvements and additions in these areas:
GPU Accelerators
- Support for Unified Shared Memory extension of OpenCL™ API
When you use the GPU Offload analysis type to profile OpenCL applications, you can now profile the CPU-side stacks for GPU computing tasks and identify bottlenecks related to Unified Shared Memory (USM) for the OpenCL API. - Support for DirectML API
This release also extends profiling support in the GPU Offload and GPU Compute/Media Hotspots analysis types for Microsoft® DirectX* applications to include support for the DirectML API.
Platform Support
- Support for Legacy Processors
VTune Profiler now supports the following generations of processors in client and server platforms:- Server CPUs: Intel® Xeon® 3rd generation processors and newer.
- Client CPUs: Intel® Core™ 4th generation processors and newer.
Starting with this release, VTune Profiler does not support processors older than the versions listed above. To analyze performance on older processors, use an older version of VTune Profiler.
Overview
Updated Intel® VTune™ Profiler version 2022.2.0 to include functional and security updates. Users should update to the latest version.
This version of Intel® VTune™ Profiler contains improvements and additions in these areas:
HPC Performance Characterization Analysis
- Better Hardware Observability
This release adds the Platform Diagram to the Summary tab of the HPC Performance Characterization analysis result.
Analysis Intel® VTune™ Profiler Server
- New Command-Line Options for Convenience
The vtune-backend binary that launches Intel® VTune™ Profiler server features new command-line options to make setup in certain environments more convenient. You can now specify a base URL that Intel® VTune™ Profiler server will use as a basis for URL generation.
Overview
This version of Intel® VTune™ Profiler contains improvements and additions in these areas:
Managed Code Targets
- .NET 6 Support
This release introduces support for analyzing .NET 6 targets using User-Mode Sampling.
Input and Output Analysis
- Intel® VT-d Observability
Intel® Virtualization Technology for Directed I/O (Intel® VT-d) observability is introduced in the Input and Output analysis for server platforms based on 3rd Gen Intel® Xeon® Scalable processors (code named “Ice Lake”), the Intel Atom® P5900 Processor Family (code named “Snow Ridge”), and newer.
Application Performance Snapshot
- Histograms in Metric Tooltips
The metric tooltips in Application Performance Snapshot HTML reports were enhanced with histograms that clearly visualize the distribution of metric values that were observed during analysis.
Operating System Support
- New Host Operating Systems Supported
This release introduces support for these operating system hosts:- Microsoft Windows* 11
- Ubuntu 21.10
- Support for First Generation of Intel® Arc™ High-performance Discrete GPUs
This release of VTune Profiler supports the first generation of Intel® Arc™ high-performance discrete GPUs code named Alchemist, and previously known as DG2. The support includes:- Explicit support for DPC++, DirectX, Intel® Media SDK, OpenCL™, and OpenMP-offload software technologies.
- Support for multi-GPU systems. You can now profile all Intel GPU devices, including integrated and discrete GPUs.
- Support for GPU Offload and GPU Hotspots analyses, including source level in-kernel profiling.
Overview
This version of Intel® VTune™ Profiler contains improvements and additions in these areas:
User Interface
- Rich Metric Tooltips in Multiple Analyses
- Detection of Compilation with Low Optimization Level in Hotspots Analysis
- Platform Diagram Extended with Persistent Memory Block
- Changes to Viewpoint Selection
Analysis Targets
- Extended FreeBSD* OS Support
Platform Analyses
- CPU Throttling Data in System Overview Analysis
Architecture Support
- Analysis Support for Intel® microarchitecture code named Alder Lake
VTune Profiler Server
- New Capabilities for Account and Privilege Handling
Accelerators
- Host-GPU Bandwidth Information in GPU Offload Analysis
- PCIe* Bandwidth Information in Custom and Command Line Runs of GPU Offload Analysis
- Improvements to Peak Occupancy Metric
- Support to Trace DirectX API on CPU Host
- Data Collection of CPU Host Stacks
- Enhancements to GPU Offload Summary
2021
Overview
This version of Intel® VTune™ Profiler contains improvements and additions in these areas:
User Interface
- Rich Metric Tooltips in Multiple Analyses
- Detection of Compilation with Low Optimization Level in Hotspots Analysis
- Platform Diagram Extended with Persistent Memory Block
- Changes to Viewpoint Selection
Analysis Targets
- Extended FreeBSD* OS Support
Platform Analyses
- CPU Throttling Data in System Overview Analysis
Architecture Support
- Analysis Support for Intel® microarchitecture code named Alder Lake
Intel® VTune™ Profiler Server
- New Capabilities for Account and Privilege Handling
Accelerators
- Host-GPU Bandwidth Information in GPU Offload Analysis
- PCIe Bandwidth Information in Custom and Command Line Runs of GPU Offload Analysis
- Improvements to Peak Occupancy Metric
- Support to Trace DirectX API on CPU Host
- Data Collection of CPU Host Stacks
- Enhancements to GPU Offload Summary
Overview
This version of Intel® VTune™ Profiler contain improvements and additions in these areas:
Analysis Targets
- Extended Support for .NET5 Workloads
You can now analyze .NET5 workloads in Attach to Process mode when using Hardware Event-Based Sampling. - Support for Unified Shared Memory Workloads
You can profile OpenCL, SYCL, and DPC++ applications that use Unified Shared Memory (USM) workloads. - Input and Output Analysis on FreeBSD* OS
You can now run the Input and Output analysis on remote FreeBSD targets. Analysis scope is limited to platform-level metrics.
Accelerators
- Hottest CPU Tasks in GPU Offload Analysis
The Summary view in the GPU Offload Analysis now includes the Hottest Host Tasks table, which displays the most active tasks running on the CPU. -
Support for Affinity Mask
If you use the ZE_AFFINITY_MASK variable to bind your workload to a single tile, VTune Profiler can then attribute kernels to the correct tile and also display relevant metrics per kernel.
Code Annotations
- New Instrumentation and Tracing Technology API Capabilities
A new Histogram API was added to ITT API. This API enables you to collect arbitrary histogram data without extra overhead.
Overview
This version of Intel® VTune™ Profiler contains improvements and additions in these areas:
Algorithm Group
- Flame Graph View in Hotspots Analysis
This version of Intel® VTune™ Profiler introduces support for Flame Graphs in the Hotspots analysis type. The Hotspots by CPU Utilization viewpoint has been enhanced with a Flame Graph window that displays a graphical view of hot code paths.
Debug Formats
- Support for DWARF 5 Debug Format
Intel® VTune™ Profiler now supports version 5 of the DWARF debug format. You can now use debug information in DWARF 5 format to resolve function names and source locations for binaries.
GPU Accelerators
- CPU Context for GPU Execution in GPU Offload Analysis
The GPU Offload Analysis now presents a richer set of information about execution on the GPU by including context from the CPU.
This includes stack information on:- Execution
- Data transfer from host to device
- Data transfer from device to host
- Analysis of Multiple GPUs
When you have multiple GPUs connected to your system, you can now analyze all of the GPUs collectively with the GPU Offload and GPU Compute/Media Hotspots analyses.
Overview
This version of Intel® VTune™ Profiler contains improvements and additions in these areas:
Command Line Analysis
- Perf Tool Parameters for All Analysis Types
You can now use the target-system command to get parameters on the command line for the native perf tool for all analysis types including custom analyses.
GPU Accelerators
- Occupancy Report in GPU Hotspots Analysis
The GPU Compute/Media Hotspots analysis has been enhanced to display occupancy information in the Summary section.
Microarchitecture Analyses
- Platform Diagram in Memory Usage View
This release introduces the Platform diagram in the Memory Usage viewpoint of the Memory Access analysis type.
Overview
This version of Intel® VTune™ Profiler contains improvements and additions in these areas:
Intel® VTune™ Profiler – Platform Profiler as Analysis Type
- Platform Profiler has been completely integrated into Intel® VTune™ Profiler as an analysis type.
Application Performance Snapshot
- Outlier Detection
A new mechanism for the detection of outliers, or individual metric values that contribute to an average metric that differ significantly from the overall distribution or break a certain threshold. - Metric Tooltip Enhancements
Metric tooltips now visualize ranges of average metrics, with their minimum, maximum, and average contributing values.
MPI Applications Support
- Support for MPI applications in GPU and IO analyses
The GPU Offload, GPU Compute/Media Hotspots, and Input and Output analyses now support profiling of MPI applications, as described in the MPI Code Analysis topic.
Overview
This version of Intel® VTune™ Profiler contains improvements and additions in the following:
Improvements to Vectorization Information
- The Vectorization sections of Performance Snapshot and HPC Performance Characterization analyses have been enriched to provide a clearer picture of the state of vectorization in your application.
Support for the 3rd Gen Intel® Xeon® Scalable processors (code name Ice Lake Server)
- This release introduces full support for the Ice Lake Server architecture in the Input and Output analysis.
GPU Analyses Improvements
- Advanced Data Transfer Information in GPU Offload
- Advanced analysis of Low occupancy problems for GPU computing tasks
Project Navigator User Experience
- The Project Navigator pane now features menu options to open a new or existing project to better facilitate your VTune™ experience.
GPU Analysis Coverage for Self-Check
- Coverage of checks by the self-check functionality in VTune™ Profiler now includes GPU analyses as wel
Overview
This version of Intel® VTune™ Profiler contains improvements and additions in the following:
Application Performance Snapshot:
- Rich metric tooltips in HTML reports
- PCIe bandwidth info in CLI reports
- New reports and filters
Support for Code Targets
- Support for running the Hotspots analysis on .NET 5 targets in Launch Application mode when using hardware event-based sampling.
Hardware Support
- Support for Intel processor architecture code named Ice Lake Server including Microarchitecture Exploration Analysis.
Overview
This version of Intel® VTune™ Profiler contains improvements and additions in the following:
User Interface:
Introduced a new main vertical toolbar to enhance user experience.
Hardware Support
Support for Intel Atom® Processor P Series code named Snow Ridge, including Hotspots, Microarchitecture Exploration, Memory Access, and Input and Output analyses.
GPU Accelerators
Source-level analysis for DPC++ and OpenMP applications running on GPU over Level Zero.
Input and Output Analysis
New major features in Input and Output analysis:
- Platform Diagram
- Extended Intel® Data Direct I/O (Intel DDIO) utilization efficiency metrics
- Linux perf-based data collection without root access on Linux kernel versions 5.10 and newer
Overview
Intel® VTune™ Profiler has been updated to include more recent versions of 3rd party components, which include functional and security updates. Users should update to the latest version.
GPU Accelerators:
- GPU Adapter Selection for Profiling Analyses in Multi-GPU Systems
- Energy Consumption Metrics in GPU Compute/Media Hotspots Analysis
FPGA Accelerators:
- Multiple enhancements to CPU/FPGA Interaction Analysis
Energy Analysis:
- Rootless Data Collection on Linux Systems
2020
Overview
Intel® VTune™ Profiler has been updated to include more recent versions of 3rd party components, which include functional and security updates. Users should update to the latest version.
Hardware Support:
- Added support for 11th Gen Intel® Core™ processors codenamed Tiger Lake, including Hotspots, Microarchitecture Exploration, Memory Access, and GPU analyses.
Input and Output Analysis:
- Source-level Memory Mapped I/O (MMIO) analysis now supports InfiniBand devices.
Profiling Applications Annotated with ITT API:
- Profiling of applications annotated with ITT API has been enhanced by the introduction of additional Average Task Time and Average Frame Time metrics.
Profiling Remote Amazon Web Services* Instances:
- Added support for remote profiling of applications running in Amazon Web Services* (AWS) EC2 instances.
Overview
Intel® VTune™ Profiler has been updated to include more recent versions of 3rd party components, which include functional and security updates. Users should update to the latest version.
Performance Snapshot analysis type for quick summary:
- This release introduces the Performance Snapshot analysis type. Start with this analysis and get a quick overview of issues that affect your application performance. Performance Snapshot characterizes the workload on the system. It also provides rev
Overview
Intel® VTune™ Profiler has been updated to include more recent versions of 3rd party components, which include functional and security updates. Users should update to the latest version.
Performance Snapshot analysis type for quick summary:
- This release introduces the Performance Snapshot analysis type. Start with this analysis and get a quick overview of issues that affect your application performance. Performance Snapshot characterizes the workload on the system. It also provides recommendations for next steps to help you select other analyses for deeper profiling.
-
Platform Analysis:
- Platform I/O metrics can now be attributed to individual devices managed by Intel® VMD technology
- I/O Analysis has been enhanced for Sky Lake and Cascade Lake servers by highlighting code potentially performing MMIO reads
-
New hardware/operating systems/IDEs support:
- Support for Intel’s processors code named Cooper Lake and Comet Lake
- Ubuntu* 20.04, Fedora* 32
- Microsoft* Windows* 10, May 2020 Update
-
Deprecation:
- We recommend that Storage Snapshot users switch to using the Platform Profiler feature of Intel® VTune™ Profiler. It provides a more informative set of data with a similar low overhead. We are deprecating Storage Snapshot and will discontinue it in our next major release.
- Preview of Input and Output analysis on Windows* is deprecated and will be removed in a future release. This analysis continues to be supported on Linux* OS.
- commendations for next steps to help you select other analyses for deeper profiling.
Platform Analysis:
- Platform I/O metrics can now be attributed to individual devices managed by Intel® VMD technology
- I/O Analysis has been enhanced for Sky Lake and Cascade Lake servers by highlighting code potentially performing MMIO reads
New hardware/operating systems/IDEs support:
- Support for Intel’s processors code named Cooper Lake and Comet Lake
- Ubuntu* 20.04, Fedora* 32
- Microsoft* Windows* 10, May 2020 Update
Deprecation:
- We recommend that Storage Snapshot users switch to using the Platform Profiler feature of Intel® VTune™ Profiler. It provides a more informative set of data with a similar low overhead. We are deprecating Storage Snapshot and will discontinue it in our next major release.
- Preview of Input and Output analysis on Windows* is deprecated and will be removed in a future release. This analysis continues to be supported on Linux* OS.
Overview
This version of Intel® VTune™ Profiler contains improvements and additions in these areas:
- Microarchitecture Exploration analysis is now supported on Intel processors codenamed Icelake.
- GPU accelerators support:
- GPU Compute/Media Hotspots analysis in the Dynamic Instruction Count mode has been extended to include SIMD utilization metrics at the kernel and instruction level. These metrics help identify instructions in the OpenCL™ kernel that utilize SIMD poorly.
- A deeper GPU utilization analysis has been introduced in Application Performance Snapshot (APS) and the HPC Performance Characterization analysis. The GPU utilization analysis now includes these GPU computation metrics:
- GPU Time
- GPU IPC
- GPU Utilization
- % of Stalled and Idle EUs.
- There is now a simplified dependency on the Intel® Metric Discovery API library to collect GPU hardware statistics on Linux* systems. VTune Profiler now automatically selects the latest libstdc++ available in runtime to satisfy the GPU analysis requirements. For older versions of the product, follow procedures to enable manual configuration.
Platform analysis improvements:
- CPU/FPGA Interaction analysis has been extended to process data sources collected either with AOCL Profiler (new mode) and via OpenCL Profiling API (legacy mode). Specify the name of your application target and its parameters directly in the WHAT pane.
- The Hardware Tracing mode in the System Overview analysis has been extended to include new metrics to make the analysis more kernel-aware:
- OS Kernel Activity and OS Scheduling metrics identify anomaly issues caused by unexpected kernel activity or preemptions.
- The CPU Time metric has been split to User Time and Kernel Time metrics to show the number of kernel mode switches and their frequency (switches per second).
- A new Module Entry Point grouping level has been added to the System Overview viewpoint to display data collected in the Hardware Tracing mode. The grouping shifts the focus to precise CPU time spent within sys calls, interrupts or within particular API of the runtime library.
Overview
- There is a new, more descriptive name: “Intel® VTune™ Profiler” (formerly “Intel® VTune™ Amplifier).
- Command line interface amplxe-cl and GUI interface amplxe-gui were re-named to vtune and vtune-gui respectively
- Intel® VTune™ Profiler has been updated to include more recent versions of 3rd party components, which include functional and security updates. Users should update to the latest version.
- GPU accelerators support:
- New GPU Offload analysis added to explore and correlate code execution across CPUs and GPUs. You can identify a kernel of interest for GPU-bound applications and explore further with GPU Compute/Media Hotspots analysis.
- GPU Compute/Media Hotspots analysis updated with GPU in-kernel analysis for OpenCL™ code and an option to filter by a kernel of interest.
- Command line hotspots report now supports GPU analysis types. You can apply the computing-task and computing-instance groupings to your collected data to focus on time-intensive computing tasks.
- Dynamic instruction count collection (available as part of the GPU Compute/Media Hotspots Analysis) improved to provide better accuracy for basic block Assembly analysis.
- Support for Intel® Processor Graphics Gen11.
- Platform analysis support:
- System Overview analysis updated to serve as an entry point to platform analysis. Use this analysis to assess system (IO, accelerators and CPU) performance and review guidance for next steps.
- New Hardware Tracing mode in the System Overview analysis enables application analysis on the micro-second level and identification of causes for latency issues.
- HPC analysis improvements:
- Max and Bound Bandwidth metrics added to Application Performance Snapshot to better estimate the efficiency of the DRAM, MCDRAM, Persistent Memory and Cornelis Networks usage.
- Platform Profiler new features and improvements:
- Overview and Memory views extended with new metrics to analyze Non-Uniform Memory Access (NUMA) behavior.
- User authentication and authorization implemented to enable access control to user data.
- Added a new option for users to choose or modify the location of Platform Profiler data files.
- Energy analysis improvements:
- New Throttling analysis added to identify causes for system throttling, including violation of safe thermal or power limits.
- Options for Energy analysis, based on the Intel SoC Watch data collector, extended to monitor processor package energy consumption over time and identify how it correlates with CPU throttling.
- Cloud and containerization support:
- Containerization support extended with an option to install and run VTune™ Profiler in a Docker* container and profile targets inside and outside the same container.
- Added support to profile applications running in Amazon Web Services* (AWS) EC2 Instances based on Intel microarchitecture code name Cascade Lake X.
- New Fabric Profiler performance tool added to VTune™ Profiler in Preview mode. Use Fabric Profiler to identify detailed characteristics of the runtime behavior for an OpenSHMEM application.
- Quality and usability improvements:
- Symbol resolution for effective source-level analysis enabled for crossgen (Ahead-of-JIT compilation) functions on Linux* systems.
- Interactive Help Tour (available on the Welcome page) guides you through the product interface using a sample project.
- New hardware/operating systems/IDEs support:
- 10th Gen Intel® Core™ processors
- Ubuntu* 19.10
- Microsoft* Windows* 10, November 2019 Update
2019
Overview
- Bug fixes and security updates.
- Intel VTune Amplifier has been updated to include more recent versions of 3rd party components, which include functional and security updates. Users should update to the latest version.
No public release of Update 7 is available for Intel VTune Amplifier.
Overview
- Relaxed limitations on collecting GPU hardware metrics for users without Administrator/root privileges.
- Added support for HW-based analysis on systems running under Hyper-V.
- Microarchitecture analysis improvements:
- Relaxed limitations for the Perf* driverless collection on Linux for users with perf_event_paranoid value set to 2. For such environments, event-based sampling is supported in the user space.
- Memory Access analysis updated with a new UPI Utilization metric for Intel microarchitectures code named Cascade Lake and Skylake.
- Application Performance Snapshot improvements:
- Max and Bound metrics added to estimate the efficiency of the DRAM, MCDRAM, and Persistent Memory usage.
- Quality and usability improvements:
- Interactive Help Tour available from the Welcome page and guiding you through the product interface using a sample project.
- Simplified configuration of a Windows-to-Linux remote collection supporting automated password-less access to a Remote Linux (SSH) target.
- Platform Profiler improvements:
- Enhanced system overview including CPU and memory utilization summary, CPU I/O Wait information (Linux) and CPU utilization breakdown for key CPU-stall reasons
- Initial implementation of a custom view that allows users to specify the metrics to be visualized
- Full support for Intel® Optane™ DC Persistent Memory metrics on 2nd Generation Intel® Xeon® Scalable Processor server platforms (formerly Cascade Lake).
- A simplified and consistent command line interface for collecting data (the previous command line interface is supported for backward compatibility).
- A simplified and consistent command line interface for collecting data that conforms better to CLI conventions. The previous command line interface is supported for backward compatibility. See the Intel® VTune™ Amplifier User Guide for more details.
- Support for new operating systems:
- Android Q
- Red Hat* Enterprise Linux* 8
- Fedora* 30
NOTE: 32 bit OSs are deprecated in 2019 version and support will be removed in upcoming release. VTune™ can still profile 32 bit applications on 64 bit OSs (cross mode).
Overview
- GPU analysis improvements:
- Inline Mode filter option added to GPU In-Kernel Profiling viewpoint, to display GPU-side call stacks with OpenCL™ inline functions and correctly attribute GPU Cycles statistics per function. By default, Inline Mode is switched off.
- Source/Assembly analysis available for OpenCL programs created with IL (intermediate language), if the intermediate SPIR-V binary was built with the -gline-tables-only -s option.
- (PREVIEW) New Instruction Count profiling mode added to the GPU In-Kernel Profiling to analyze GPU instructions executed by an OpenCL kernel and classified per instruction type. This mode helps you compare the performance of the same OpenCL kernel on different hardware or explore instruction count for different implementations of the same algorithms on the same hardware.
- Microarchitecture analysis improvements:
- Default driverless mode for hardware event-based collections with stacks, such as Hotspots and Threading. Driver-based collection can still be run by setting the "Stack size" option to the unlimited value (0) or disabling the "Enable driverless collection" option in a custom analysis.
- The Precise column added to the Summary of the Hardware Events viewpoint to clearly identify precise events. Using precise events in your configurations provide more accurate Assembly analysis with no event skids.
- Quality and usability improvements:
- Improved integration with the Microsoft* Visual Studio* IDE with a quick access to VTune Amplifier options via a smart integrated Welcome page.
- Overlay help with quick tips for the Bottom-up tab highlights important interface elements to efficiently manage analysis data.
- Added Linux kernel 5.0 support
Overview
- Support for Intel® Optane™ DC persistent memory and the latest microarchitecture code-named Cascade Lake. This includes new hardware event support and enhanced memory analysis to design and optimize for the new persistent memory technology.
Learn more about the next generation of memory. - Resolve performance bottlenecks where network workloads are consuming high I/O bandwidth. Enhanced PCIe device metrics for I/O traffic in the Input and Output analysis help you understand the interactions between Cores and Network Interface Cards (NICs).
- MPI improvements:
- Easier control of data collection for MPI applications using the standard MPI_PControl API. Collect only the data you need with a few quick changes and no dependency on the ITT API.
- Easier MPI communication pattern diagnosis with Application Performance Snapshot’s rank to rank communication diagram by message volume.
- Usability improvements:
- Friendlier welcome page provides fast access to technical content and project controls.
- Improved importing process for traces and result files. It’s now possible to import whole result directories to a project and use project search directories for symbol and source/assembly resolution.
- Simplified installation and licensing (serial numbers and license files are no longer required for this product).
Overview
- Intel® VTune™ Amplifier 2019 Update 2 includes functional and security updates. Users should update to the latest version.
- Microarchitecture analysis improvements:
- Configuration for the Microarchitecture Exploration analysis optimized to provide you with the control over collected hardware metrics and data collection overhead in general. By default, the analysis provides you with a full set of top-level hardware metrics and their sub-metrics that show how your code uses hardware resources. With a new configuration option, you can choose to narrow down the scope and collect sub-metrics only for the selected top-level metrics.
- System Analyzer tool for monitoring real-time metrics on a target system added to the VTune Amplifier as a PREVIEW feature.
- HPC workload profiling improvements:
- Full-featured support of OpenMPI targets in Application Performance Snapshot
- Vectorization metrics streamlined for the HPC Performance Characterization analysis
- PREVIEW: HTML report added to show process/thread affinity along with CPU execution and remote access information
- Supported managed Linux and Windows targets with tiered compilation for .NET* Core 3.0 Preview 1 and .NET Core 2.2
- Quality and usability improvements:
- Improved support for standalone command-line results imported into a VTune Amplifier GUI project. Search directories specified in the command line configuration are preserved and applied for proper module resolution in the graphical viewpoints.
Overview:
- Threading analysis extended with the lower overhead hardware event-based sampling mode. This mode helps analyze an impact of thread preemption and context switching. On Windows*, this analysis configuration requires the sampling driver. On Linux*, the analysis is available both with the sampling driver and with the Linux Perf* collector for kernels 4.4 and higher.
- Quality and usability improvements:
- summary command line report for the Hotspots analysis enriched with metrics and Top 5 Hotspots table that is also available from the GUI Summary view.
- A sample matrix project added to the Project Navigator to help you get started with the product, review a sample pre-collected Hotspots result, and test other analysis types and source view options. A pre-built version of the matrix sample application and associated source files are available installed with VTune Amplifier.
- Support for Linux Perf* collection extended with VTune Amplifier metrics with a further option to import the Perf trace to the VTune Amplifier GUI and benefit from predefined viewpoints. This solution could be useful for performance analysis in data centers)
Overview:
- New, easier tuning workflow and simplified setup
- New Platform Profiler. Longer data collection finds hardware configuration issues and poorly tuned applications.
- Application Performance Snapshot adds utilization of logical vs. physical cores, pause and resume and Intel Trace Analyzer and Collector integration
2018
Overview:
- Support for new operating systems:
- SUSE* Linux* Enterprise Server (SLES)12 SP3, SUSE* Linux* Enterprise Server (SLES)15
- Red Hat* Enterprise Linux* 6.10
- Fedora 28
- Microsoft Windows* 10 RS4
Overview:
- Analysis on embedded platforms and accelerators:
- New CPU/FPGA Interaction analysis (PREVIEW) to assess the balance between the CPU and FPGA on systems with a discrete Intel® Arria® 10 FPGA running OpenCL™ applications
- New Graphics Rendering analysis (PREVIEW) for CPU/GPU utilization of your code running on the Xen* virtualization platform installed on a remote embedded target
- Support for the sampling command-line analysis on remote QNX* embedded systems via ethernet connection
- HPC workload profiling improvements:
- CPU Utilization metric refined to differentiate the utilization on logical vs. physical cores, which is particularly important for HPC applications running on Intel® Xeon® processor family processors
- Managed runtime analysis improvements:
- Extended JIT profiling for server-side applications running on the LLVM* or HHVM* PHP servers to support the event-based sampling analysis in the attach mode
- Extended Java* code analysis with support for OpenJDK* 9 and Oracle* JDK 9
- Enabled Advanced Hotspots analysis for .NET* Core applications running on Linux and Windows systems in the Launch Application mode
- Application Performance Snapshot improvements:
- Added the ability to pause/resume collection with MPI_Pcontrol and itt API. The -start-paused option was added to exclude application execution from collection from the start to the first collection resume occurrence.
- Enabled selection of which data types are collected to reduce overhead. The choices include MPI tracing, OpenMP tracing, hardware counter based collection, or a combination of the three.
- Exposed the CPU Utilization metric by physical cores on processors that support proper hardware events.
- Significantly reduced MPI tracing overhead when there are a large number of ranks.
- Enriched MPI statistics generated by the aps-report utility by showing information about communicators used in the application and to group and filter collective operations by the communicators.
- Improved integration with Intel® Trace Analyzer and Collector by adding the ability to generate profiling configuration files with the aps-report option.
- Quality and usability improvements:
- Hardware event-based analysis supported for targets running in the Hyper-V* environment on Windows* 10 Fall Creators Update (RedStone3)
- Support for new operating systems and IDEs including:
- Fedora*
- Ubuntu* 17.10
Overview
- Mitigated impact of OS security updates
- Collect only the data you need with Application Performance Snapshot’s new data selection options and pause/resume API support. Get better answers with lower overhead.
- Assess the balance between the CPU and FPGA with a new CPU/FPGA Interaction analysis (PREVIEW)
- CPU utilization for physical and logical cores improves analysis of hyper-threading and thread migration performance effects.
- Improvements to JIT profiling for server-side applications and support for OpenJDK* 9 and Oracle* JDK 9.
- Profile .Net Core applications running on Linux* or Windows* systems with Advanced Hotspots analysis
- Hardware event-based analysis supported for targets running in the Hyper-V* environment on Windows* 10 Fall Creators Update (build 1709)
Overview
- Easier tuning of threaded MPI applications. HPC analysis adds enhanced metrics for MPI including MPI imbalance & performance of critical path rank. Application Performance Snapshot merges MPI + Application data, includes richer metrics, and adds MPICH compatibility.
- Optimize private cloud-based applications. Profile inside Docker & Mesos containers and attach to running Java services and daemons.
- Easier analysis of remote Linux* systems. Automated install of performance collectors on a remote Linux target.
2017
Linux* Release Notes macOS* Release Notes Windows* Release Notes
This update is optional unless you need the new features.
Overview
- Support for Microsoft Visual Studio* 2017 Update 3
- Bug fixes and performance improvements
Linux* Release Notes macOS* Release Notes Windows* Release Notes
This update is optional unless you need the new features.
Overview
- General Exploration, Memory Access, HPC Performance Characterization analysis types extended to support Intel® Xeon® Processor Scalable family
- Support for Microsoft Windows* 10 Creators Update (RS2)
Linux* Release Notes macOS* Release Notes Windows* Release Notes
This update is optional unless you need the new features.
Overview
- Application Performance Snapshot (Preview) provides a quick look at your application performance and helps you understand where your application will benefit from tuning. The revised tool shows metrics on MPI parallelism (Linux* only), OpenMP* parallelism, memory access, FPU utilization, and I/O efficiency with recommendations on further in-depth analysis.
- Support for Intel® Xeon Phi™ coprocessor targets codenamed Knights Landing
- Improved insight into parallelism inefficiencies for applications using Intel Threading Building Blocks (Intel TBB) with extended classification of high Overhead and Spin time.
- Automated installation of the VTune Amplifier collectors on a remote Linux target system. This feature is helpful if you profile a target on a shared resource without VTune Amplifier installed or on an embedded platform where targets may be reset frequently.
- Support for Microsoft Visual Studio* 2017
Linux* Release Notes OS X* Release Notes Windows* Release Notes
This update is optional unless you need the new features.
Overview
- All license types now support cross-OS analysis. Installation packages for additional operating systems can be downloaded from the registration center.
- HPC Performance Characterization analysis improvements
- DRAM Bandwidth Bound metric in the Memory Usage viewpoint for the Memory Access and HPC Performance Characterization analyses
- GPU Hotspots Summary view extended to provide the Packet Queue Depth and Packet Duration histograms for the analysis of DMA packet execution.
- Support for performance analysis of a guest Linux* operating system via Kernel-based Virtual Machine (KVM) from a Linux host system with the KVM Guest OS option
- Support for mixed Python* and native code in the Locks and Waits analysis
- Improved Support:
- Ubuntu* 16.10 and Fedora* 25
- 7th Generation Intel® Core™ processors (codenamed Kaby Lake)
- Intel® Atom™ processors (codenamed Apollo Lake and Denverton)
- Intel® Xeon Phi™ coprocessor targets (codenamed Knights Landing) from Linux* OS host
Details
HPC Performance Characterization Analysis improvements
The HPC Performance Characterization Analysis has received several improvements.
Increased detail and structure for the vector efficiency metrics based on FLOP counters in the FPU Utilization section help diagnose the reason for low utilization connected with poor vector code generation. Relevant metrics include:
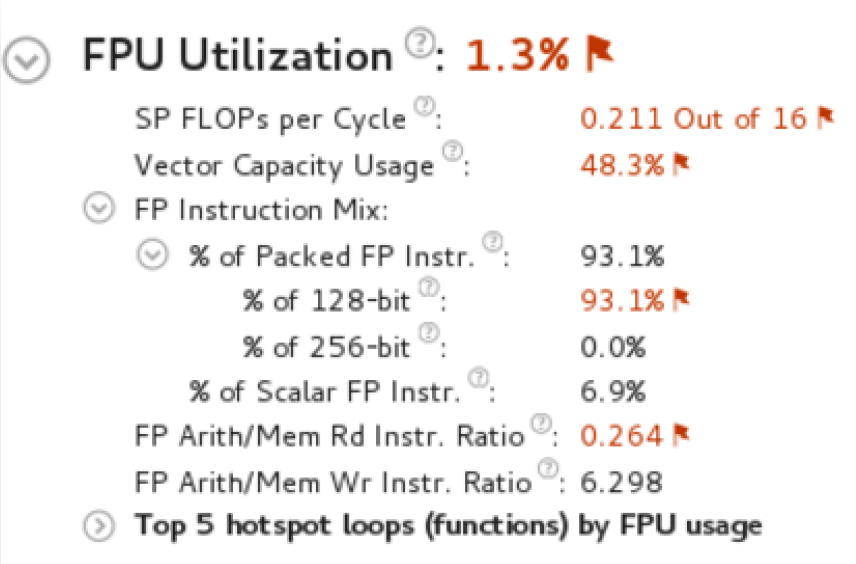
- Vector Capacity Usage
- FP Instruction Mix
- FP Arithmetic Instructions per Memory Read or Write
- SP FLOPs per Cycle (may indicate memory bandwidth bound code)
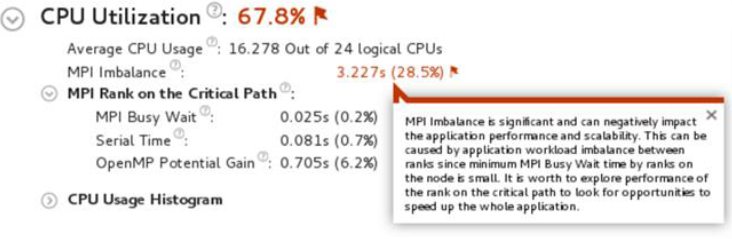
For MPI applications, the MPI Imbalance metric shows CPU time spent by ranks spinning in waits on communication operations, normalized by the number of ranks on the profiling node. The metric issue detection description generation is based on minimal MPI Busy Wait time by ranks. If the minimal MPI Busy Wait time by ranks is not significant, then the rank with the minimal time most likely lies on the critical path of application execution. In this case, review the CPU utilization metrics by this rank.
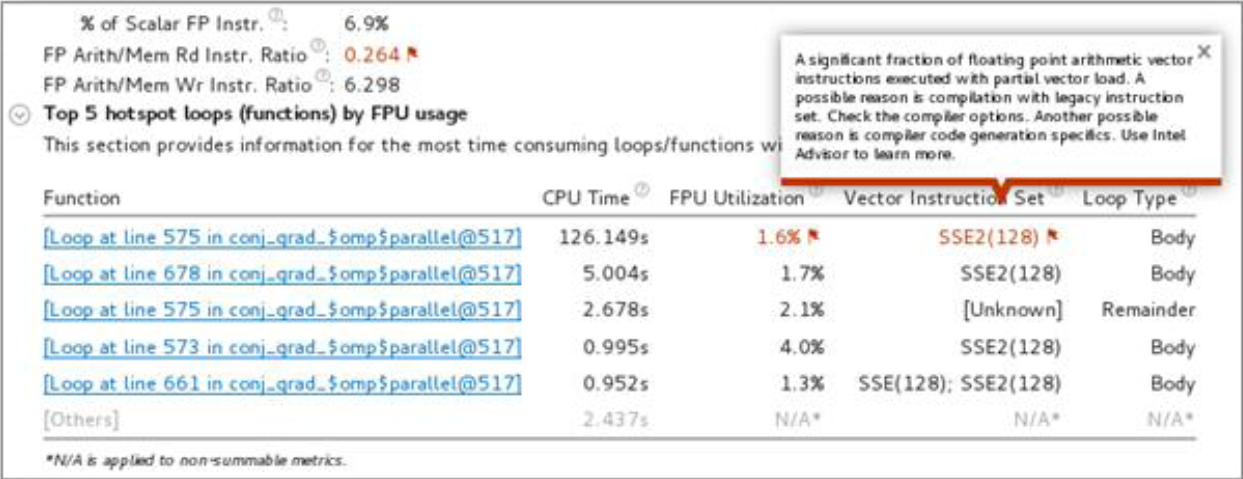
The Top Loops/Functions with FPU Usage by CPU Time table shows the top functions that contain floating point operations, sorted by CPU time. The FPU Utilization column provides issue descriptions based on whether a loop/function is bandwidth bound, whether it is vectorized or scalar, and what instruction set it's using.
For Intel Xeon Phi processors (codenamed Knights Landing), the following FPU metrics are available instead of FLOP counters:
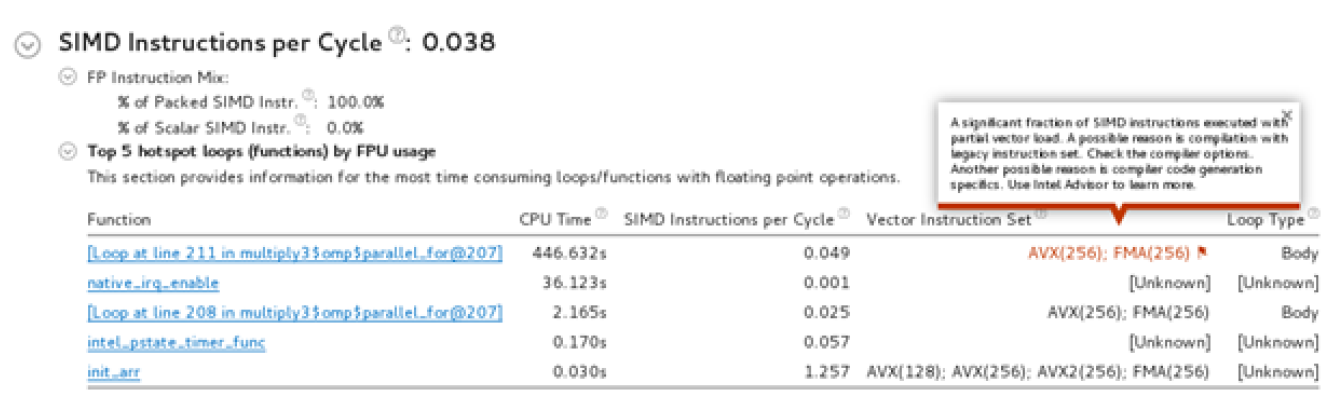
- SIMD instructions per cycle
- Fraction of packed SIMD instructions vs scalar SIMD instructions per cycle
- Vector instruction set for loops based on static analysis
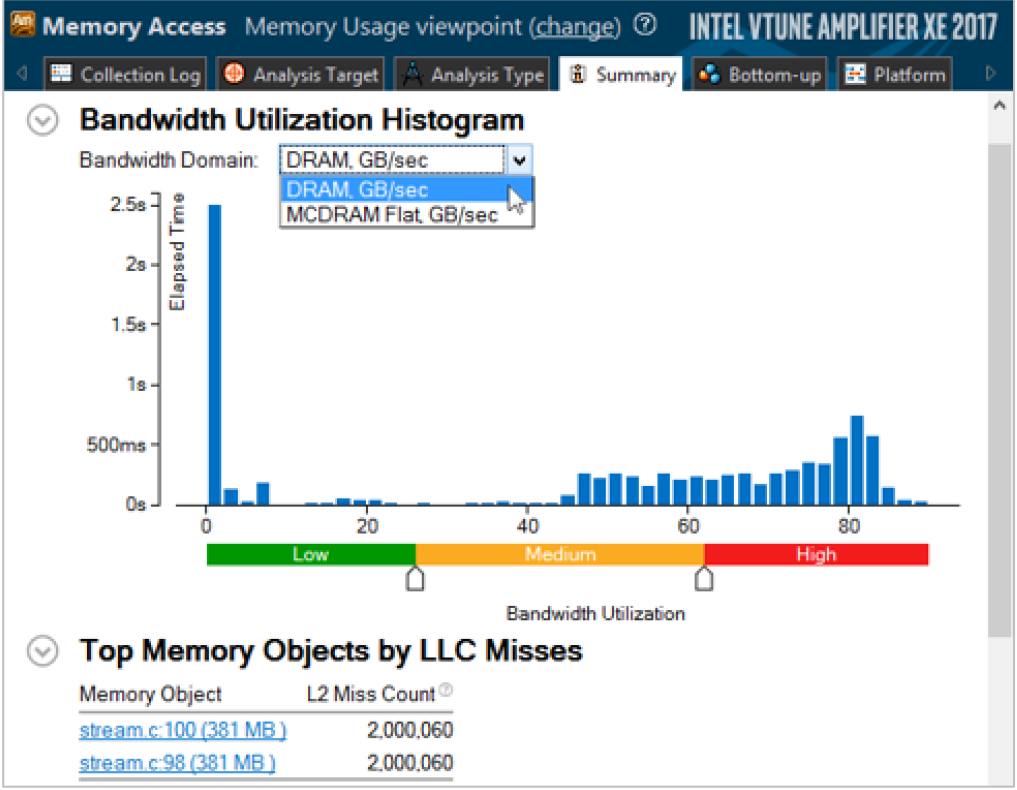
DRAM Bandwidth Bound metric
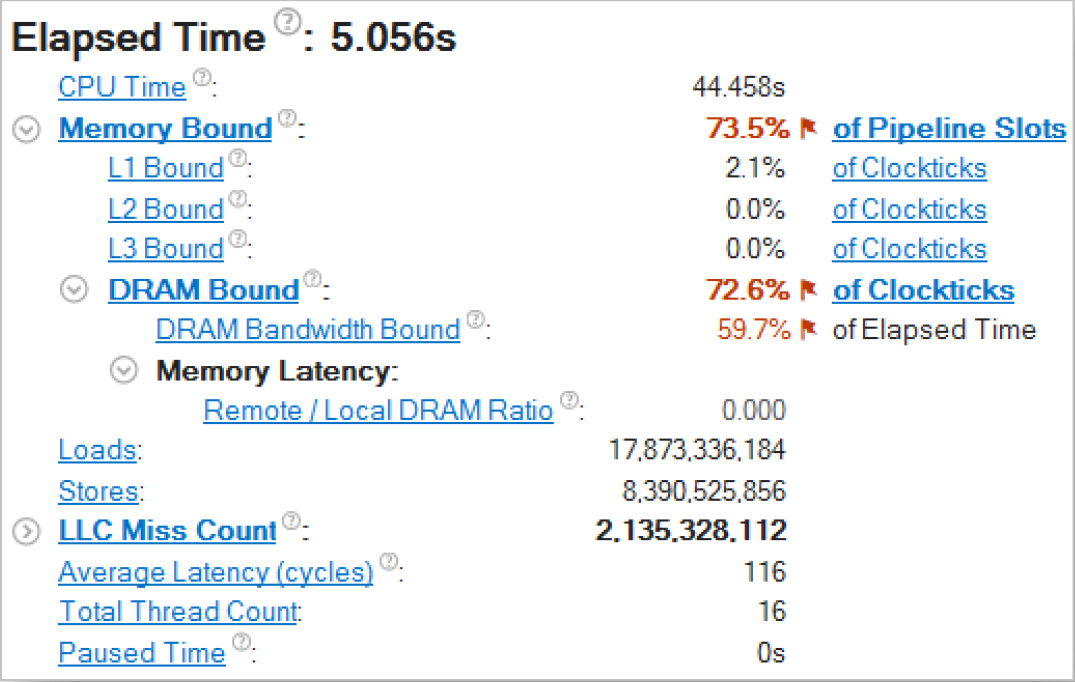
A new metric is available in the Memory Usage viewpoint for the Memory Access and HPC Performance Characterization analyses which indicates whether your system spent much time heavily utilizing the DRAM bandwidth. The calculation of this metric relies on accurate maximum system DRAM bandwidth measurement, and depends on the number of sockets on your system.
GPU Hotspots Summary improvements
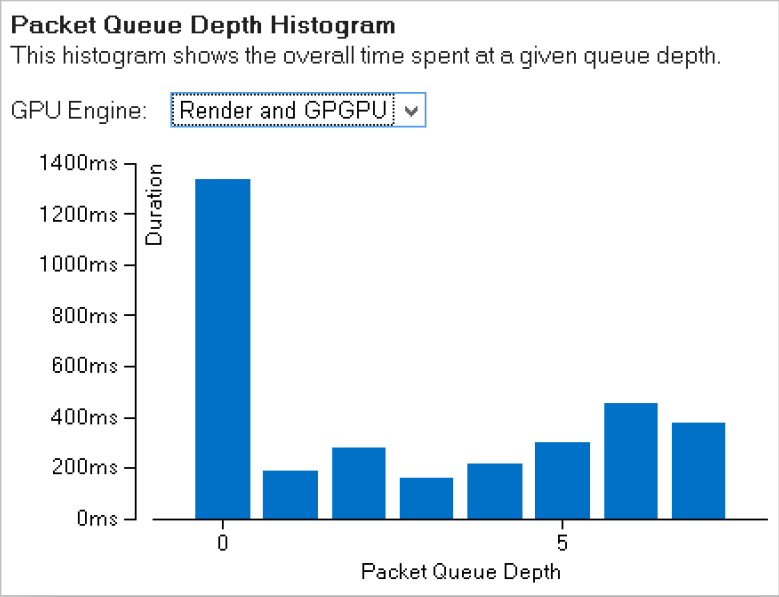
The GPU Hotspots viewpoint's Summary tab has been extended to display more information. The GPU Usage section can be used to identify whether the GPU was properly utilized. The Packet Queue Depth Histogram can be used to estimate the GPU software queue depth per GPU engine during the target run. Ideally, your goal is an effective GPU engine utilization with evenly loaded queues and minimal duration for the zero queue depth.
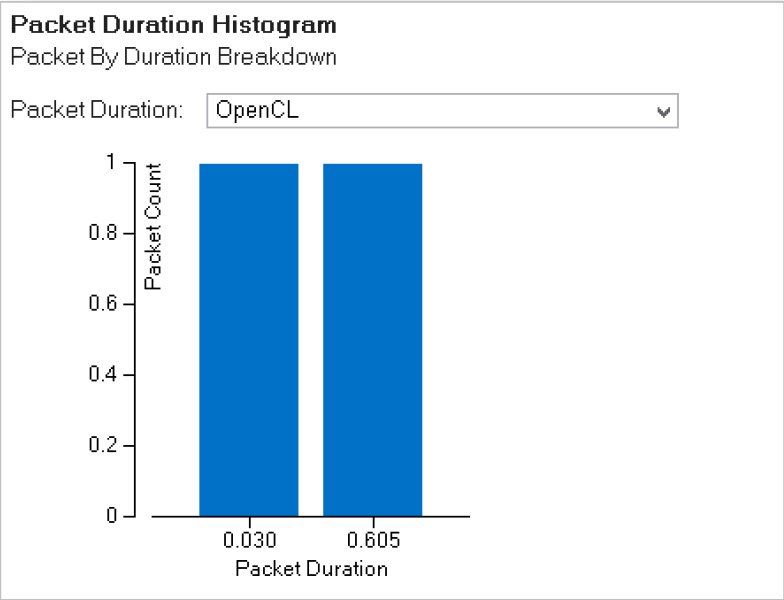
For a high-level view of the DMA packet execution during the target run, review the Packet Duration Histogram. Select a required packet type from the drop-down menu and identify how effectively these packets were executed on the GPU. Having high packet count values for the minimal duration is optimal.
KVM Guest OS Profiling
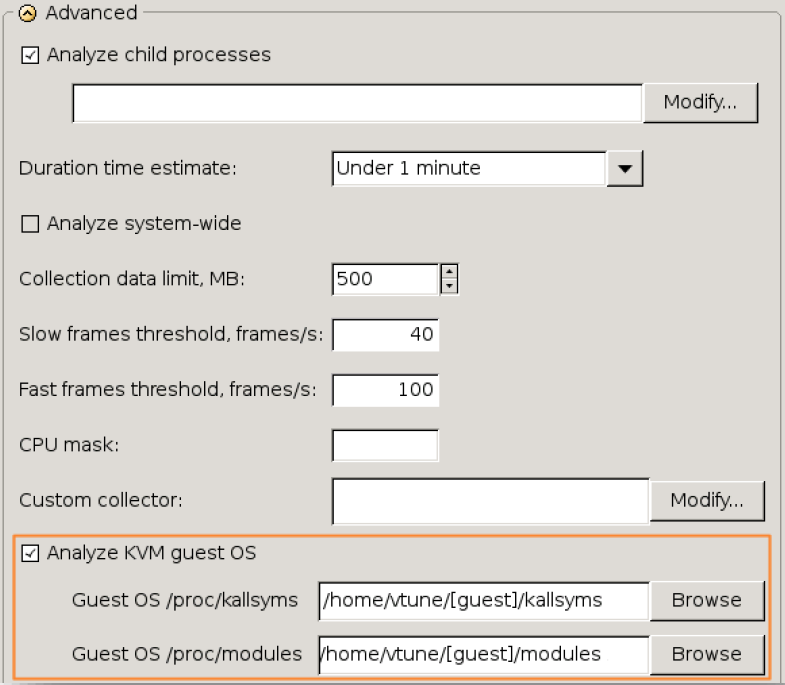
If you are a system developer and interested in the performance analysis of a guest Linux* system, use Intel VTune Amplifier for performance analysis of this guest Linux* OS via Kernel-based Virtual Machine (KVM) from the host system. Depending on your analysis target, you may choose either of the following usage models for KVM guest OS profiling:
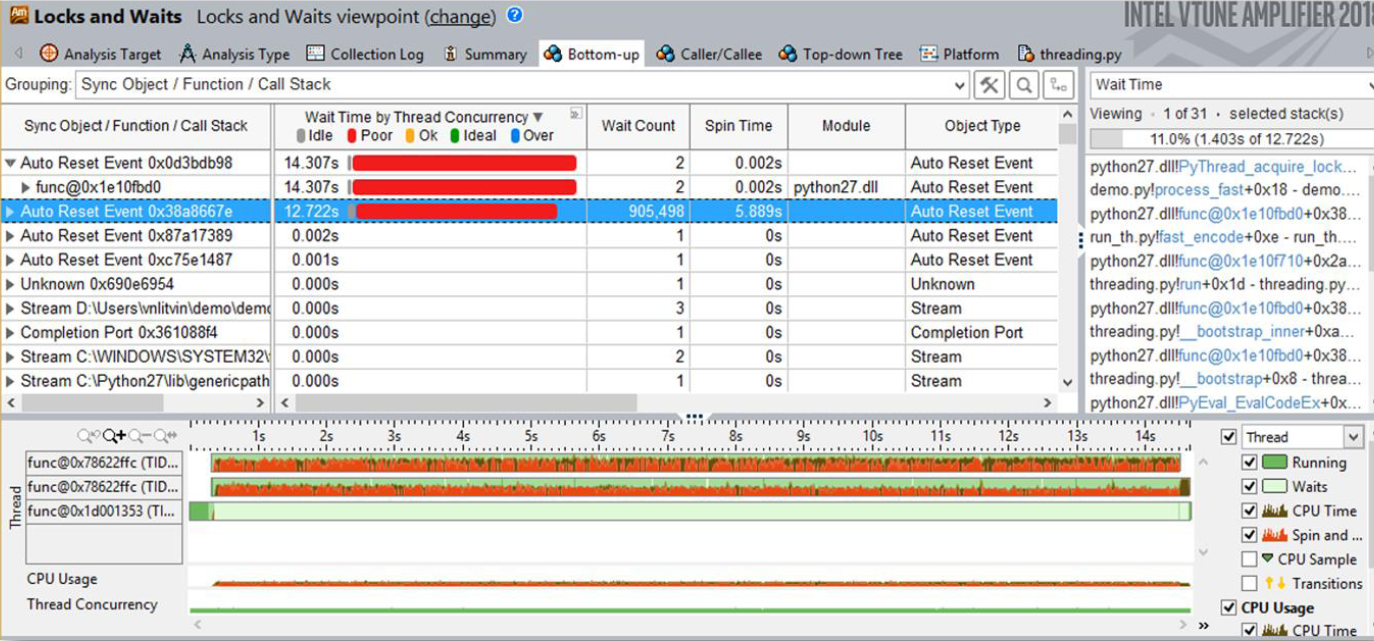
Locks & Waits analysis for Python
Locks and Waits analysis can now be used to tune threaded performance of mixed Python* and native code. View Sync Objects in the grid, see Python frames in the Call Stack, an define which sync objects are the Global Interpreter Lock (GIL), either by wait count or by callstack. Drill down to Python source to explore thread synchronization issues at code level. For more information on how to configure the analysis, see the Python* Code Analysis product help article.
Linux* Release Notes OS X* Release Notes Windows* Release Notes
- Support for the Average Latency metric in the Memory Access analysis based on the driverless collection
- Support for locator hardware event metrics for the General Exploration analysis results in the Source/Assembly view that enable you to filter the data by a metric of interest and identify performance-critical code lines/instructions
- Command line summary report for the HPC Performance Characterization analysis extended to show metrics for CPU, Memory and FPU performance aspects including performance issue descriptions for metrics that exceed the predefined threshold. To hide issue descriptions in the summary report, use a new report-knob show-issues option.
- Summary view of the General Exploration analysis extended to explicitly display measure for the hardware metrics: Clockticks vs. Piepline Slots
- GPU Hotspots analysis extended to detect hottest computing tasks bound by GPU L3 bandwidth
- PREVIEW: New Full Compute event group added to the list of predefined GPU hardware event groups collected for Intel® HD Graphics and Intel Iris™ Graphics. This group combines metrics from the Overview and Compute Basic presets and allows to see all detected GPU stalled/idle issues in the same view.
- Support for hotspot navigation and filtering of stack sampling analysis data by the Total type of values in the Source/Assembly view
Linux* Release Notes OS X* Release Notes Windows* Release Notes
Overview
- Support for the Intel® Xeon Phi™ Processor Codenamed Knights Landing (KNL) including General Exploration, Memory Access, HPC Performance Characterization analysis and PMU event reference.
- Disk Input and Output analysis (Preview) that monitors utilization of the disk subsystem, CPU and PCIe buses, helps identify long latency of I/O requests and imbalance between I/O and compute operations.
- Memory Access analysis improvements
- HPC workloads profiling improvements
- GPU analysis improvements
- Usability improvements
- Intel Performance Snapshot (Preview) introduces several tools as part of the VTune™ Amplifier
- Improved support:
- Python* (with Basic Hotspots analysis, via the Launch Application or Attach to Process mode)
- Go* (with hardware event-based analysis types)
- Windows 10 RS1 (Redstone) and Windows Server 2016
- Microsoft Visual Studio* 2015 Update 2
Details
Intel® Xeon Phi™ Processor Support
Intel® VTune™ Amplifier now supports the Intel® Xeon Phi™ Processor codenamed Knights Landing.
Decide how to use MCDRAM (the high bandwidth memory) effectively using Memory Access Analysis, analyze the scalability of MPI and OpenMP* with HPC Performance Characterization Analysis, and explore the microarchitecture efficiency with General Exploration Analysis.
HPC Performance
The HPC Performance Characterization Analysis explores the three key performance aspects of application scalability:
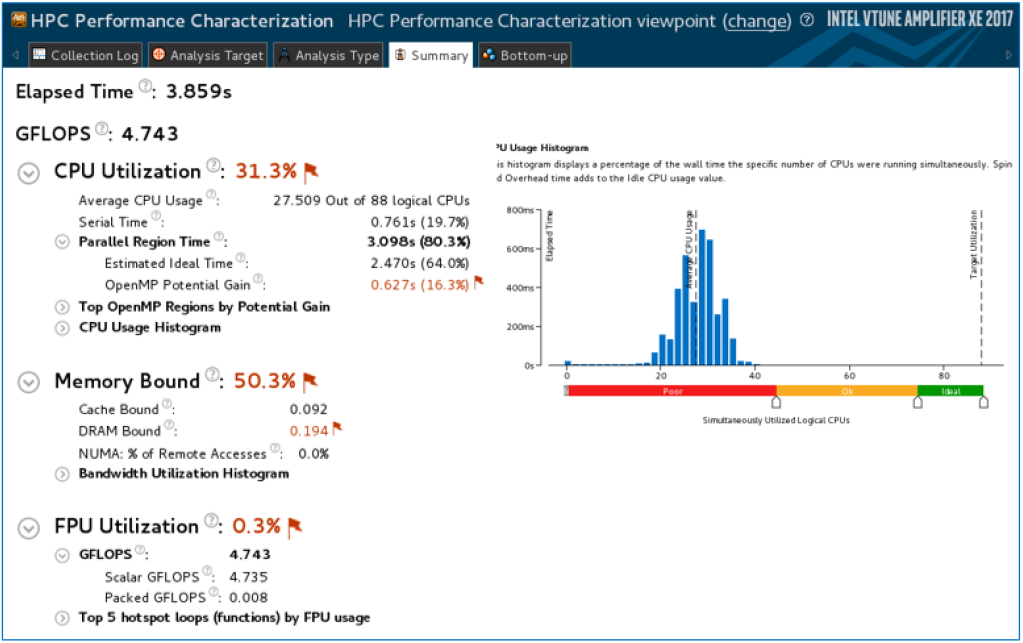
- Threading: CPU Utilization with parallel efficiency for MPI and OpenMP*. Explore the serial vs parallel time and the top OpenMP regions by potential gain.
- Memory Access Efficiency: includes bandwidth utilization and stalls by memory hierarchy.
- FPU utilization: includes basic vectorization metrics.
See the analysis usage example in the Analyzing an OpenMP and MPI Application web-based tutorial, which provides a hands-on exercise to identify memory utilization inefficiencies and load imbalance for a sample hybrid application.
Memory Access Analysis

The Memory Access Analysis has been improved. In addition to support for the Intel Xeon Phi processors, it now supports custom memory allocators, and includes automatic detection of maximum system DRAM bandwidth characteristics and scaling bandwidth data from that maximum. This allows users to easily see how they actually utilize the available DRAM bandwidth, rather than just raw GB/S values. The QPI bandwidth has been split to Total, Outgoing, and Incoming, instead of just the total. The workflow has been optimized for identifying the top memory objects with high bandwidth utilization per domain. Finally, no special drivers are required on Linux*; this analysis type can now use standard Linux* perf to collect data, eliminating the need for root to install other drivers.
Disk I/O Analysis (Preview)
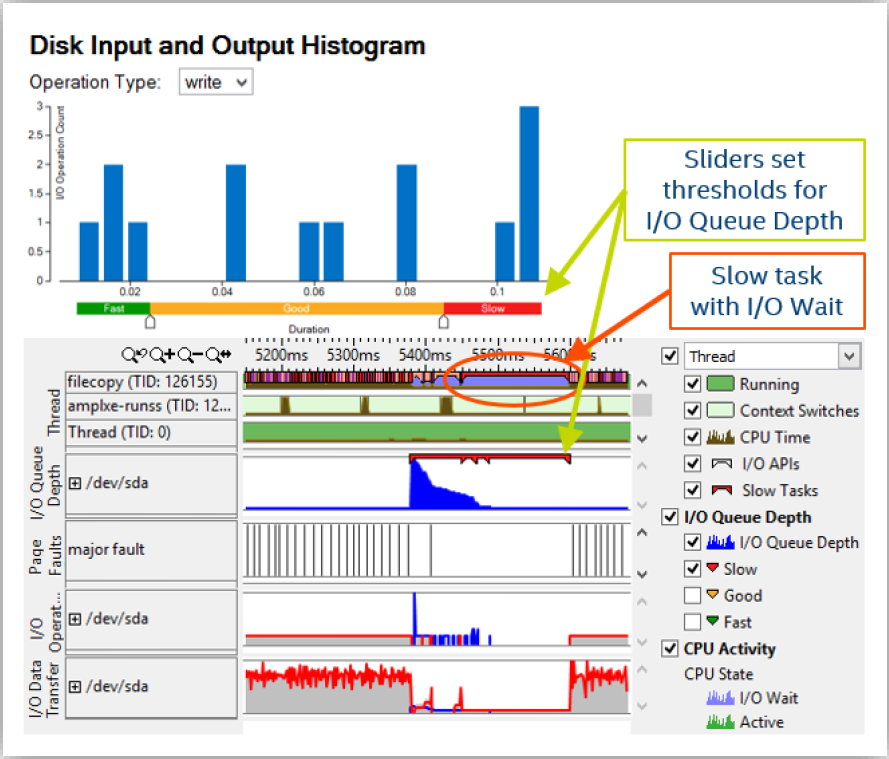
The Disk Input and Output analysis for HDD, SATA, or NVMe SSD monitors utilization of the disk subsystem, CPU, and PCle buses, and helps to identify long latency of I/O requests and imbalance between I/O and compute operations.
See the Analyzing Input/Output Waits tutorial for a hands-on exercise with sample code on Linux*.
GPU analysis improvements
GPU Hotspots Analysis is intended for GPU-bound applications, and provides options to analyze execution of OpenCL™ kernels and Intel® Media™ SKD tasks.
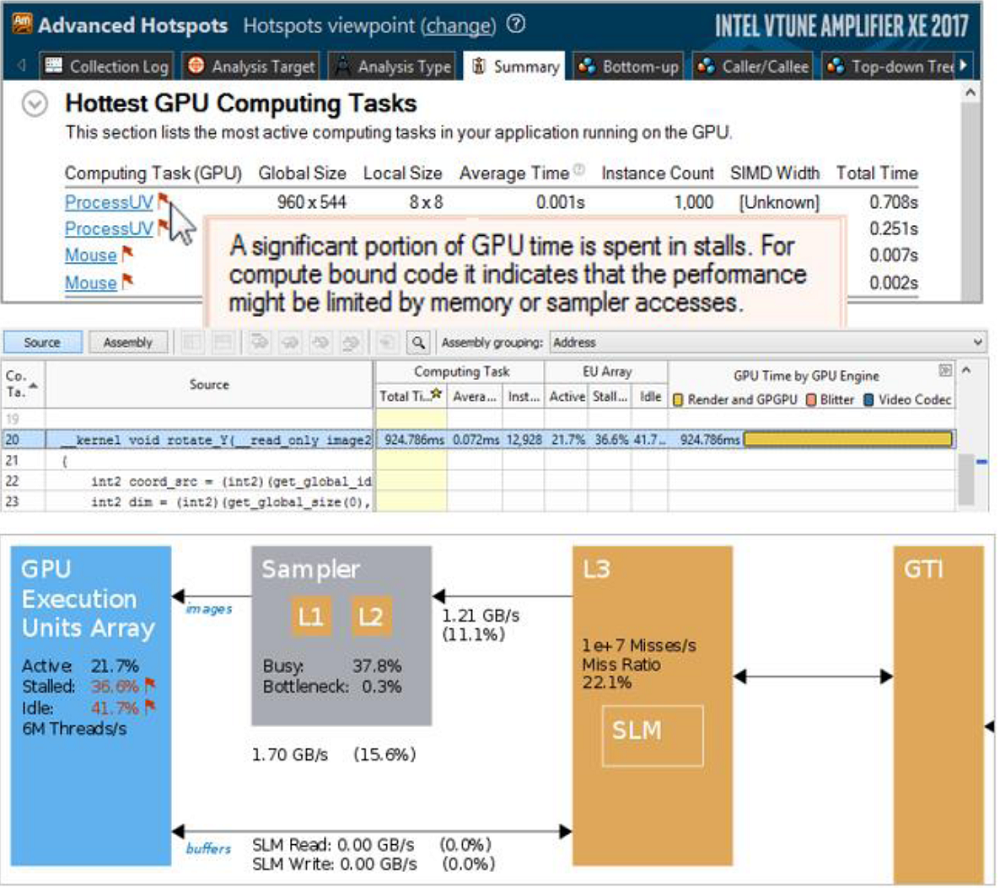
The GPU Analysis Summary provides a set of metrics to estimate the GPU utilization per engine, identify stalled or idle execution units, and explore the most typical problems with low occupancy or frequent sampler accesses. Navigate from the Hottest GPU computing tasks summary to the details provided in the graphics tab.
Intel VTune Amplifier now also supports the detection of OpenCL 2.0 Shared Virtual Memory (SVM) usage types per kernel instance.
For more information, see Using Intel VTune Amplifier to Optimize Media & Video Applications.
Usability Improvements
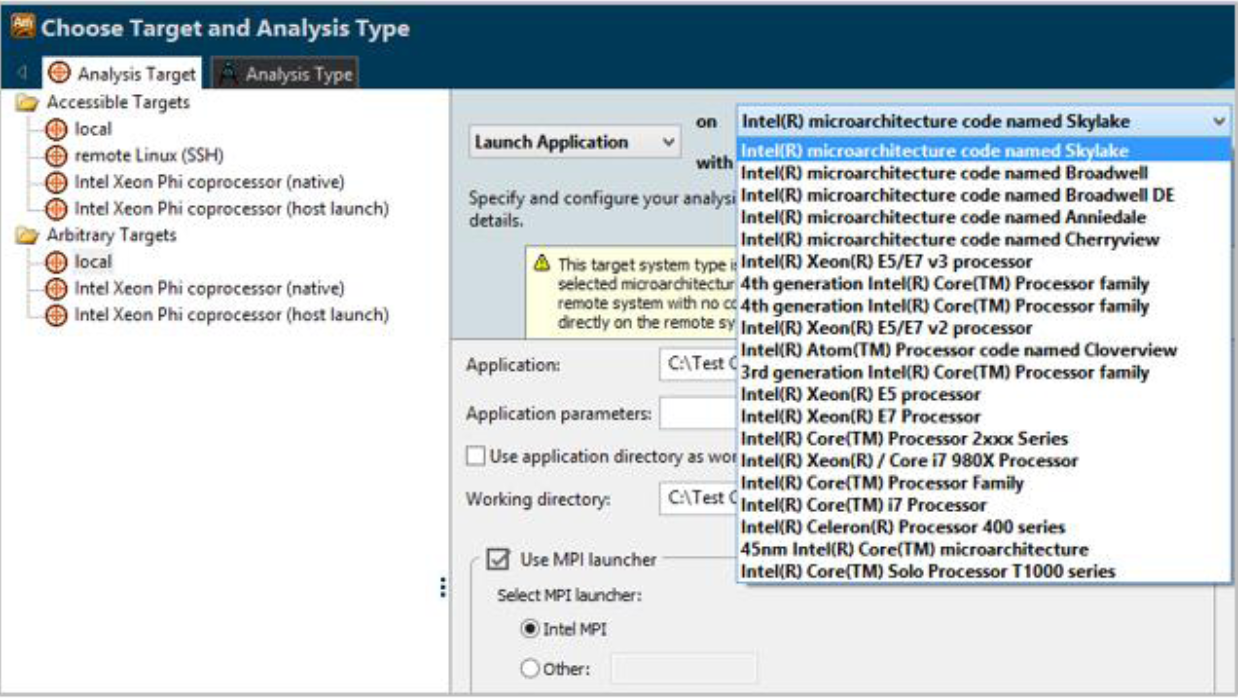
Remote usage and Command Line usage have been improved. Use the Arbitrary target GUI configuration to generate a command line for performance analysis on a system that is not accessible from the current host.
MPI analysis has been extended with the event-based sampling collection supported for multiple ranks per node with an arbitrary MPI launcher and natural syntax. Use the MPI launcher option in the arbitrary targets configuration to automatically generate a command line for MPI analysis from the GUI.
An option for enabling and disabling the OpenMP regions analysis has been added to selected analysis configurations.
Support has been added for the Attach To Process target type with event-based sampling for low-privilege Java* daemons on Linux*.
The event selection mechanism for custom hardware event based sampling has been extended with filtering options.
The grid views and identification of performance issues have had UI improvements made.
Intel® Performance Snapshot (Preview)
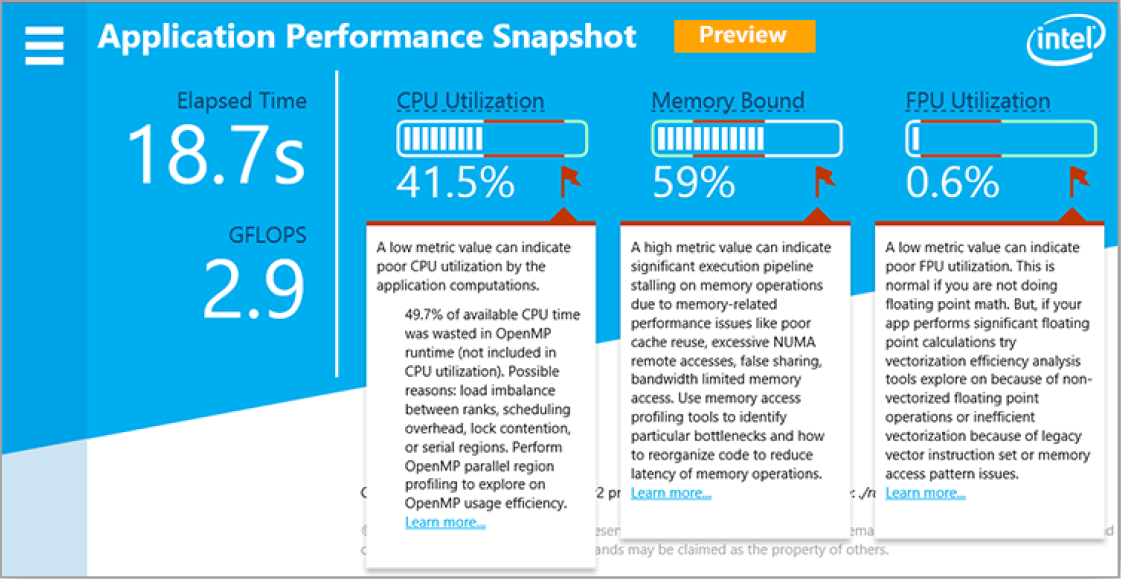
The Application Performance Snapshot tool provides a quick look at your application performance and helps you understand whether your application will benefit from tuning.
It identifies how effectively your application uses the hardware platform and displays basic performance enhancement opportunities.
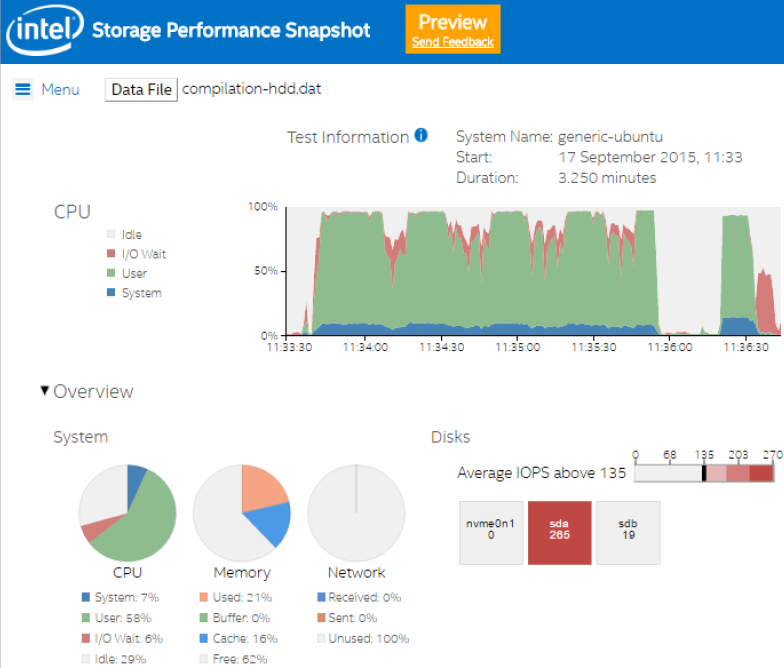
The Storage Performance Snapshot tool analyzes your system's storage, CPU, memory, and network usage and displays basic performance enhancement opportunities for systems using Intel hardware.