Tutorial: Analyze Common Performance Bottlenecks using Intel VTune Profiler in a C++ Sample Application - Windows* OS
Run and Interpret Hotspots Analysis
In this part of the tutorial, you run the Hotspots analysis to locate hotspots, or sections of code that contribute most to the total elapsed time of the application.
Run Hotspots Analysis
To run the Hotspots analysis from the Performance Snapshot Summary window:
Click the Hotspots icon in the Analysis tree.
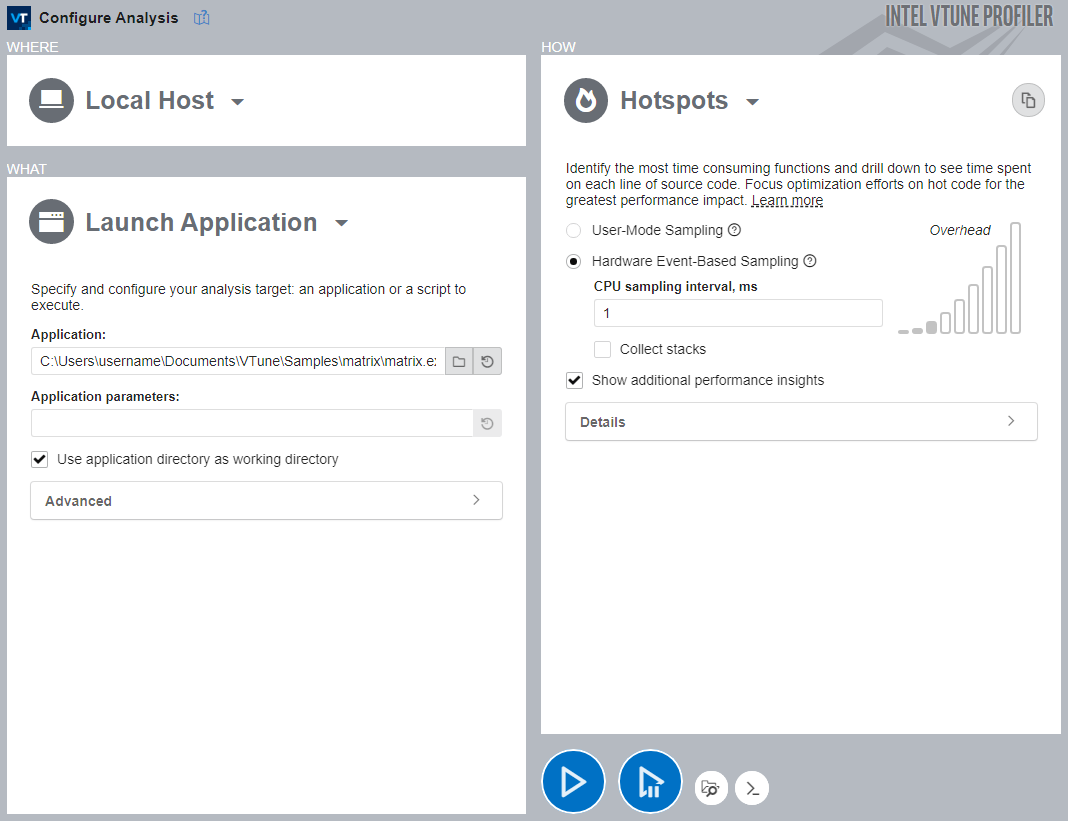
The Configure Analysis window opens.
In the WHERE pane, select Local Host.
If you’re using the pre-provided sample (matrix) project, the WHAT pane should already be configured.
If not, provide the path to the application in the Application textbox.
In the HOW pane, the Hotspots analysis is pre-selected.
For the collection mode, you can choose between User-Mode Sampling and Hardware Event-Based Sampling. These sampling methods are different, but, typically, it is better to use Hardware Event-Based Sampling when possible, since it provides greater detail with lower overhead.
Click the Start button to run the analysis.
Interpret Hotspots Result Data
Once the sample application exits, Intel® VTune™ Profiler finalizes the result and opens the Summary viewpoint.
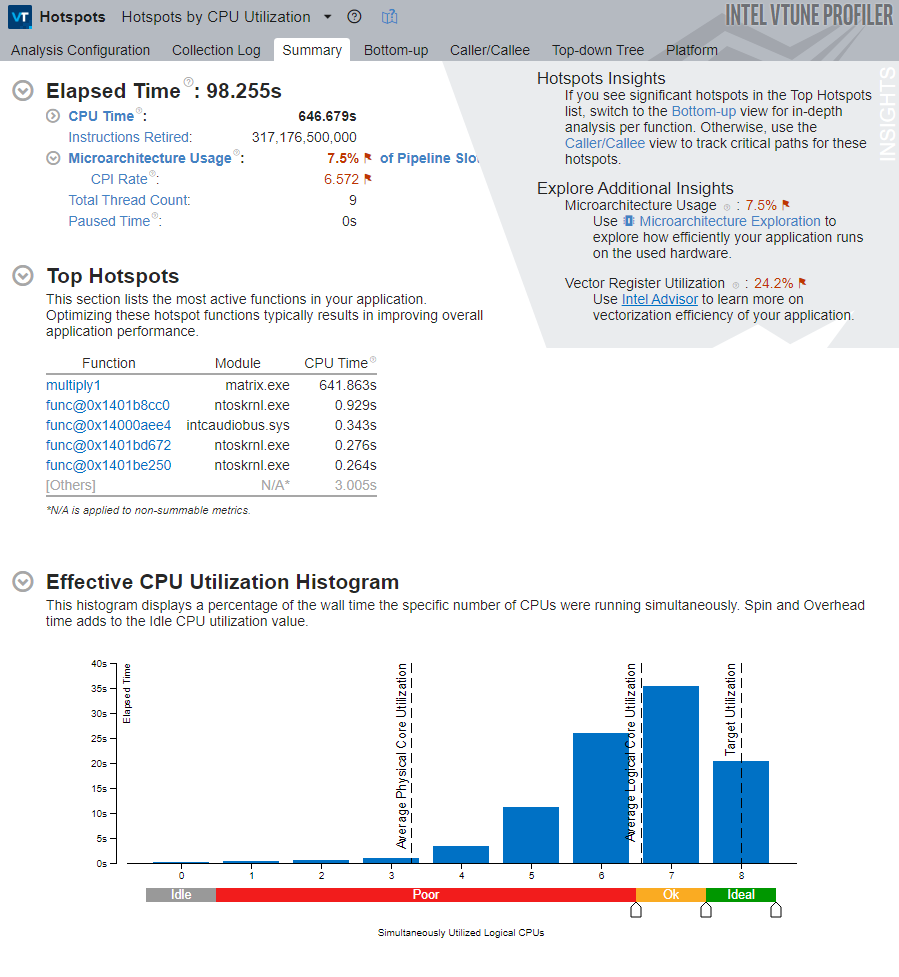
This viewpoint offers multiple metrics. Hover over the question mark icons to get a detailed description of each metric.
Note that the total CPU Time for the application is equal to about 642 seconds. It is the sum of CPU time for all threads in the application. The Total Thread Count is 9, so the application is multi-threaded.
The Top Hotspots section of the Summary window provides data on the most time-consuming functions (hotspot functions) sorted by CPU time spent on their execution. For the sample application, the multiply1 function, which took roughly 640 seconds to execute, shows up at the top of the list as the hottest function.
The Effective CPU Utilization Histogram lower on the Summary window represents the Elapsed Time and usage level for the available logical processors and provides a graphical look at how many logical processors were used during the application execution. Ideally, the highest bar of your chart should match the Target Utilization level.
Identify Most Time-Consuming Code Areas
To get a per-function view of the code, switch to the Bottom-up tab. By default, the data in the grid is grouped by function. You can change the grouping level using the Grouping menu at the top of the grid.
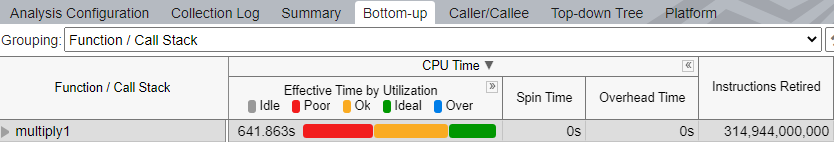
The multiply1 function took the most time to execute, roughly 640 seconds, and shows a poor CPU utilization.
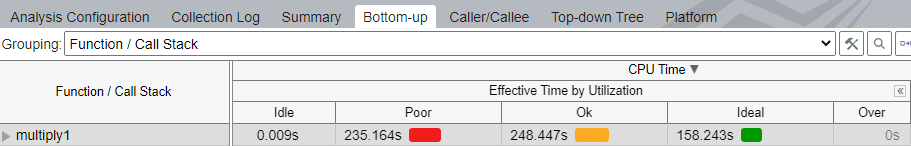
To get the detailed CPU utilization information per function, use the  Expand button in the Bottom-up pane to expand the Effective Time by Utilization column.
Double-click the multiply1 function on the Bottom-up grid to open the Source window.
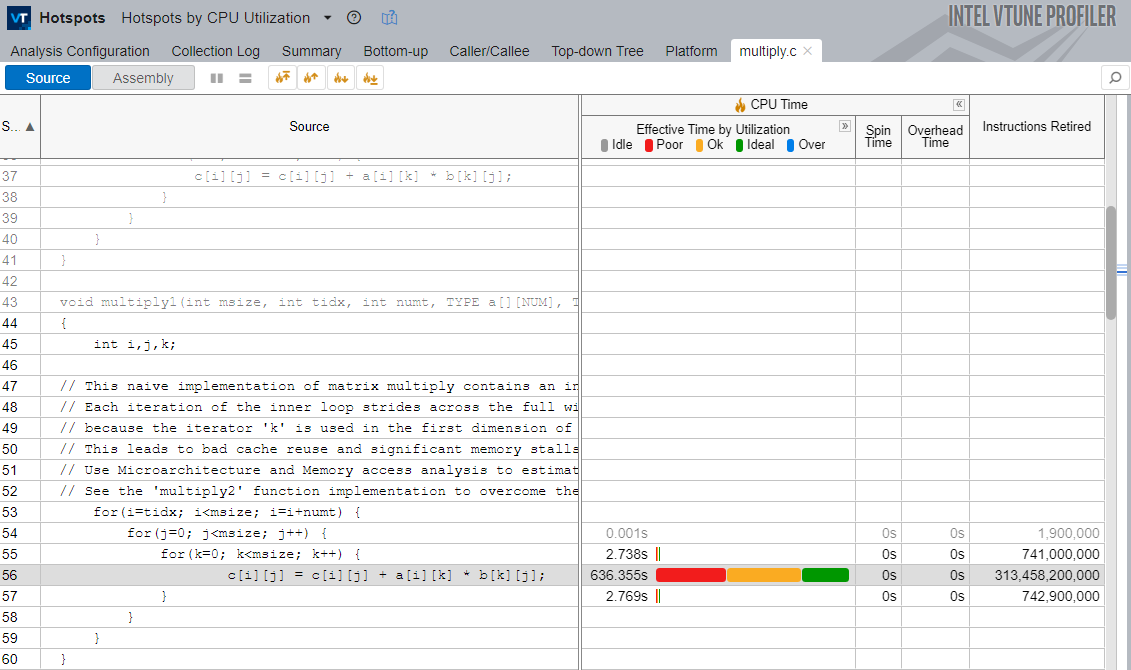
Note that the most time-consuming line is attributed to the loop that performs the matrix multiplication in the multiply1 function.
To analyze the behavior of this loop in relation to memory, run the Memory Access analysis.
Next step: Analyze Memory Access.