Tutorial: Analyze Common Performance Bottlenecks using Intel VTune Profiler in a C++ Sample Application - Linux* OS
Analyze Microarchitecture Usage
In the previous part, Performance Snapshot highlighted an issue with microarchitecture utilization. In this part of the Tutorial, you run the Microarchitecture Exploration analysis to look for optimization opportunities.
While the previous optimizations resulted in great benefit to the total elapsed time of the application, there are still areas for improvement. The Performance Snapshot analysis has highlighted that the microarchitecture is not utilized well.
Run the Microarchitecture Exploration analysis to identify opportunities for improvement.
Run Microarchitecture Exploration Analysis

To run the Microarchitecture Exploration analysis:
In the Performance Snapshot analysis tree, click the Microarchitecture Exploration analysis icon.
In the HOW pane, enable all extra options.
Click the Start button to run the analysis.
Interpret Microarchitecture Exploration Result Data
Once the application exits, Intel® VTune™ Profiler opens the default Summary window.
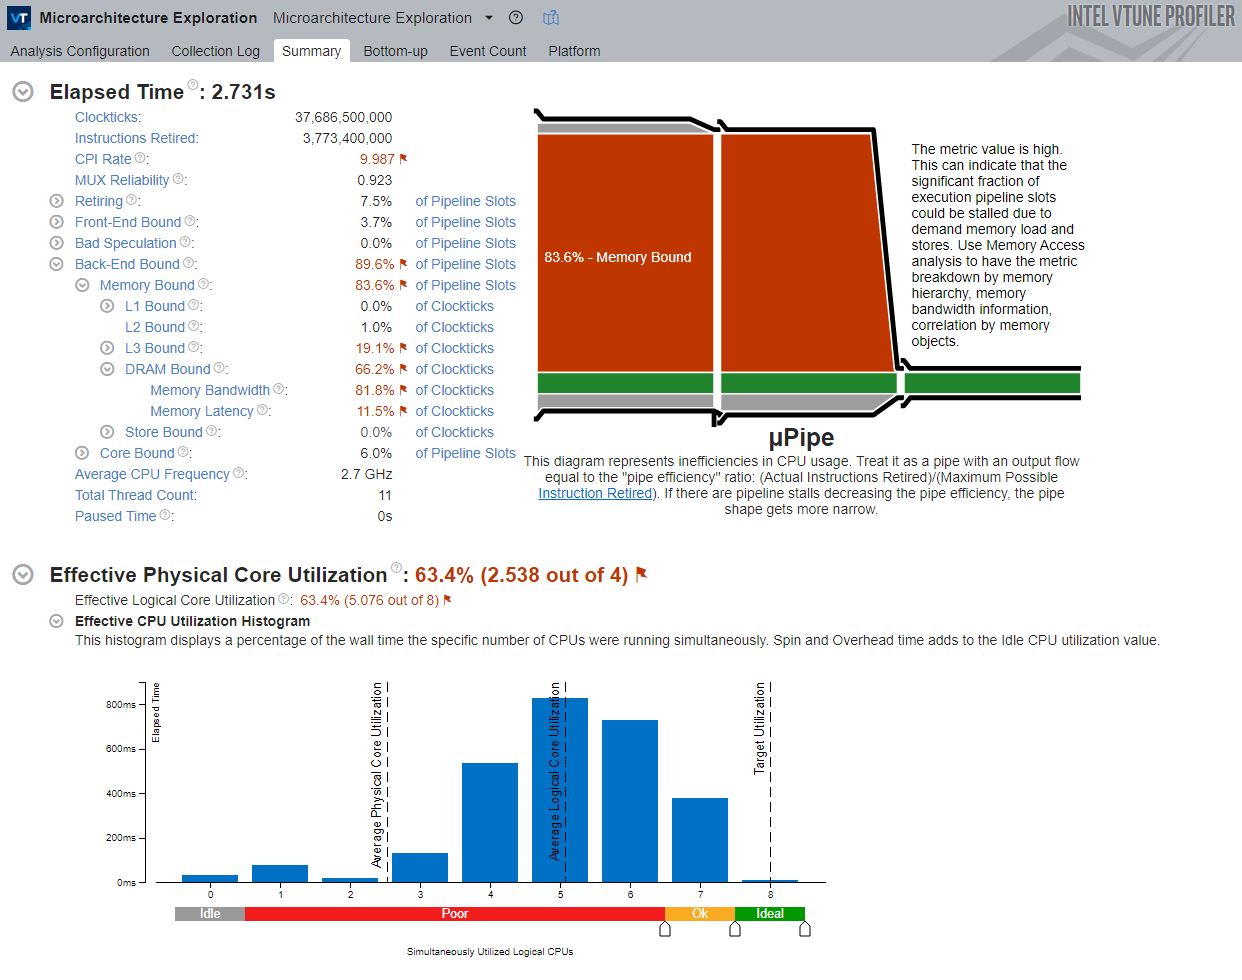
This view shows the following:
Elapsed Time section: this section shows metrics related to hardware utilization levels for your hardware. Hover over the flagged metrics to get a description of the issues, possible causes, and suggestions for resolving the issue.
The hierarchy of event-based metrics in the Microarchitecture Exploration viewpoint depends on your hardware architecture. Each metric is an event ratio defined by Intel architects and has its own predefined threshold. Intel® VTune™ Profiler analyzes a ratio value for each aggregated program unit (for example, function). When this value exceeds the threshold, it signals a potential performance problem.
µPipe Diagram: the µPipe, or Microarchitecture pipe, provides a graphical representation of CPU microarchitecture metrics showing inefficiencies in hardware usage. Treat the diagram as a pipe with an output flow equal to the ratio: Actual Instructions Retired/Possible Maximum Instruction Retired (pipe efficiency). The µPipe is based on CPU pipeline slots that represent hardware resources needed to process one micro-operation. Usually there are several pipeline slots available on each cycle (pipeline width). If a pipeline slot does not retire, this is considered a stall and the µPipe diagram represents this as an obstacle making the pipe narrow.
See the Microarchitecture Pipe page of the User Guide for a more detailed explanation of the µPipe.
Effective CPU Utilization Histogram: this histogram represents the Elapsed Time and usage level for the available logical processors and provides a graphical look at how many logical processors were used during the application execution. Ideally, the highest bar of your chart should match the Target Utilization level.
In this case, observe the following indicators:
The Memory Bound metric is high, so the application is bound by memory access.
The Memory Bandwidth and Memory Latency metrics are high.
Considering these factors together, the conclusion is that the application has a memory access issue. However, this issue is slightly different in nature from the memory access issue previously resolved using the loop interchange technique.
Before the introduction of the loop interchange, the application was mainly bound by the cache-unfriendly memory access pattern, which resulted in a large number of LLC (Last-Level Cache) misses. This, in turn, resulted in frequent requests to the DRAM.
In this case, the fact that the Memory Bandwidth metric is high means that the application has saturated the bandwidth limits of the DRAM. While nothing can be done to increase the physical capabilities of the DRAM, the application can be modified to make even better use of the Last-Level Cache and to reduce the number of loads from the DRAM even further.
(Optional) Improve Cache Reuse
In general, most developers stop further optimizing their application when they have reached their desired performance goal. The performance improvement gained by optimizing the matrix application has resulted in a decrease of application wall time from roughly 90 seconds to roughly 2.5 seconds.
If you wish to experiment further, you can modify the code to implement the cache blocking technique. Cache blocking is an approach for rearranging data access in such a way that blocks of data get loaded into the cache and are reused for as long as they are needed, greatly reducing the number of DRAM accesses.
To modify the code to use the cache blocking technique:
In the multiply.h header file, change line 36:
#define MULTIPLY multiply2
To:
#define MULTIPLY multiply4
Save changes and recompile the application.
This modifies the code to use the multiply4 function from the multiply.c source file, which implements the cache blocking technique.
Once the application is recompiled, you can run an analysis of your choice to determine the performance improvement.
Next step: Compare with Previous Result.