Get Started with Application Performance Snapshot for Linux* OS
Get Started with Application Performance Snapshot - Linux* OS
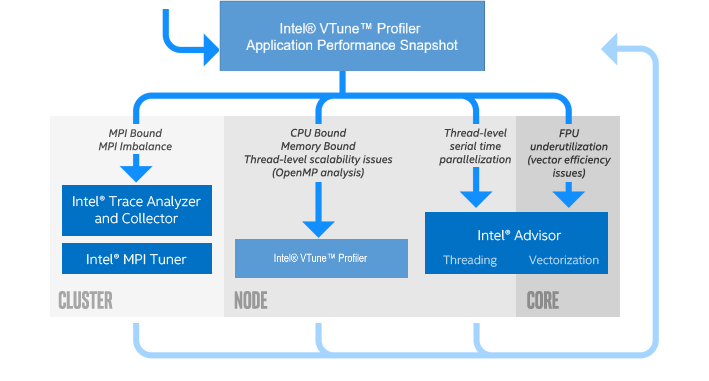
Use Intel® VTune™ Profiler Application Performance Snapshot for a quick view into different aspects of compute intensive applications' performance, such as MPI and OpenMP* usage, CPU utilization, memory access efficiency, vectorization, I/O, and memory footprint. Application Performance Snapshot displays key optimization areas and suggests specialized tools for tuning particular performance aspects, such as Intel VTune Profiler and Intel® Advisor. The tool is designed to be used on large MPI workloads and can help analyze different scalability issues.
Application Performance Snapshot comes bundled with all installations of VTune Profiler on Linux* OS.
Acquire VTune Profiler from one of these locations:
- Standalone VTune Profiler download
- As part of the Intel® oneAPI Base Toolkit
- As part of the Intel® oneAPI System Bring-Up Toolkit

Prerequisites
(Optional) Use the following software to get an advanced metric set when running Application Performance Snapshot:
- Recommended compilers: Intel® C++ Compiler Classic, Intel® oneAPI DPC++/C++ Compiler or Intel® Fortran Compiler Classic and Intel® Fortran Compiler (Beta) (other compilers can be used, but information about OpenMP* imbalance is only available from the Intel OpenMP library)
Intel® MPI library version 2017 or later. Other MPICH-based MPI implementations can be used, but information about MPI imbalance is only available from the Intel MPI library.
(Optional) Enable system-wide monitoring to reduce collection overhead and collect memory bandwidth measurements. Use one of these options to enable system-wide monitoring:
Set the /proc/sys/kernel/perf_event_paranoid value to 0 (or less), or
Install the Intel® VTune™ Profiler Sampling Driver. Driver sources are available in <vtune_install_dir>/sepdk/src. Installation instructions are available at the Build and Install the Sampling Drivers for Linux* Targets page of the VTune Profiler User Guide.
NOTE:The Intel® Omni-Path Fabric (Intel® OP Fabric) metrics are only available with the Intel® VTune™ Profiler drivers installed.
Before running the tool, you need to set up your environment:
Open a command prompt.
Set the appropriate environment variables to run the tool.
Run <vtune-install-dir>/apsvars.sh, where <vtune-install-dir> is the location where VTune Profiler was installed.
For example:
source /opt/intel/oneapi/vtune/latest/apsvars.sh
Analyzing Shared Memory Applications

Run the following command:
aps <my app> <app parameters>where <my app> is the location of your application and <app parameters> are your application parameters.
Application Performance Snapshot launches the application and runs the data collection.
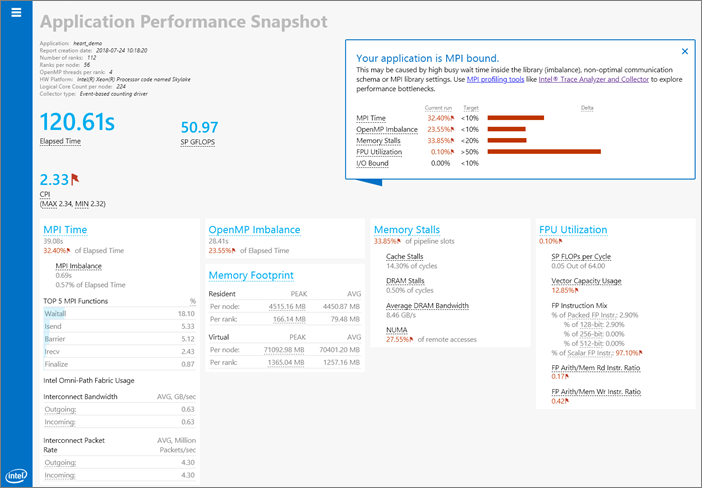
After the analysis completes, a report appears in the command window. You can also open a HTML report with the same information in a supported browser. The path to the HTML report is included in the command window. For example:
firefox aps_result_01012017_1234.htmlAnalyze the data shown in the report. See the metric descriptions below or hover over a metric in the HTML report for more information.
Determine appropriate next steps based on result analysis. Common next steps may include application tuning or using another performance analysis tool for more detailed information, such as Intel® VTune™ Profiler or Intel® Advisor.
Analyzing MPI Applications

Run the following command to collect data about your MPI application:
<mpi launcher> <mpi parameters> aps <my app> <app parameters>where:
<mpi launcher> is an MPI job launcher such as mpirun, srun, or aprun.
<mpi parameters> are the MPI launcher parameters.
NOTE:aps must be the last <mpi launcher> parameter.
<my app> is the location of your application.
<app parameters> are your application parameters.
Application Performance Snapshot launches the application and runs the data collection. After the analysis completes, a aps_result_<date> directory is created.
Run the following command to complete the analysis:
aps --report=aps_result_<date>After the analysis completes, a report appears in the command window. You can also open a HTML report with the same information in a supported browser.
Analyze the data shown in the report. See the metric descriptions below or hover over a metric in the HTML report for more information.
TIP:If your application is MPI-bound, run the following command to get more details about message passing such as message sizes, data transfers between ranks or nodes, and time in collective operations:
aps --report <option> app_result_<date>For example, to generate a graphic representation of rank-to-rank communication, use:
aps --report -x --format=html <result name>
Use $ aps-report --help to see the available options.
Determine appropriate next steps based on result analysis. Common next steps may include communication tuning with the mpitune utility or using another performance analysis tool for more detailed information, such as Intel® Trace Analyzer and Collector or Intel® VTune™ Profiler.
Next Steps

Improve accuracy and limit collected data by running Application Performance Snapshot using the pause/resume functionality or a selective collection. For instance, begin the application paused using the -start-paused option and add _itt_resume() or MPI_Pcontrol(1) to your application after a warmup phase. See the Application Performance Snapshot User's Guide for more information.
Intel Trace Analyzer and Collector: Graphical tool for understanding MPI application behavior, quickly identifying bottlenecks, improving correctness, and achieving high performance for parallel cluster applications running on Intel architecture. Improve weak and strong scaling for applications. Get started.
Intel VTune Profiler: Provides a deep insight into a node-level performance including algorithmic hotspot analysis, OpenMP* threading, general exploration microarchitecture analysis, memory access efficiency, and more. It supports C/C++, Fortran, Java*, Python*, and profiling in containers. Get started.
Intel Advisor: Provides two tools to help ensure your Fortran, C, and C++ applications realize full performance potential on modern processors. Get started.
Vectorization Advisor: Optimization tool to identify loops that will benefit most from vectorization, analyze what is blocking effective vectorization, and forecast the benefit of alternative data reorganizations.
Threading Advisor: Threading design and prototyping tool to analyze, design, tune, and check threading design options without disrupting a regular environment.
Quick Metrics Reference
The following metrics are collected with Application Performance Snapshot. Additional detail about each of these metrics is available in the Intel VTune Profiler online help.
Elapsed Time: Execution time of specified application in seconds. Execution time does not include any time the collection was paused.
SP GFLOPS: Number of single precision giga-floating point operations calculated per second. SP GFLOPS metrics are only available for 3rd Generation Intel® Core™ processors, 5th Generation Intel processors, and 6th Generation Intel processors.
DP GFLOPS: Number of double precision giga-floating point operations calculated per second. DP GFLOPS metrics are only available for 3rd Generation Intel® Core™ processors, 5th Generation Intel processors, and 6th Generation Intel processors.
Cycles per Instruction Retired (CPI): The amount of time each executed instruction took measured by cycles. A CPI of 1 is considered acceptable for high performance computing (HPC) applications, but different application domains will have varied expected values. The CPI value tends to be greater when there is long-latency memory, floating-point, or SIMD operations, non-retired instructions due to branch mispredictions, or instruction starvation at the front end.
MPI Time: Average time per process spent in MPI calls. This metric does not include the time spent in MPI_Finalize. High values could be caused by high wait times inside the library, active communications, or sub-optimal settings of the MPI library. The metric is available for MPICH-based MPIs.
MPI Imbalance: CPU time spent by ranks spinning in waits on communication operations. A high value can be caused by application workload imbalance between ranks, or non-optimal communication schema or MPI library settings. This metric is available only for Intel® MPI Library version 2017 and later.
OpenMP Imbalance: Percentage of elapsed time that your application wastes at OpenMP* synchronization barriers because of load imbalance. This metric is only available for Intel® OpenMP* Runtime Library.
Intel Omni-Path Fabric Interconnect Bandwidth and Packet Rate: Average interconnect bandwidth and packet rate per compute node, broken down by outgoing and incoming values. High values close to the interconnect limit might lead to higher latency network communications. The interconnect metrics are available for Intel Omni-Path Fabric when the Intel® VTune™ Profiler driver is installed.
CPU Utilization: Estimate of the utilization of all logical CPU cores on the system by your application. Use this metric to help evaluate the parallel efficiency of your application. A utilization of 100% means that your application keeps all of the logical CPU cores busy for the entire time that it runs. Note that the metric does not distinguish between useful application work and the time that is spent in parallel runtimes.
Memory Stalls: Indicates how memory subsystem issues affect application performance. This metric measures a fraction of slots where pipeline could be stalled due to demand load or store instructions. If the metric value is high, review the Cache and DRAM Stalls and the percent of remote accesses metrics to understand the nature of memory-related performance bottlenecks. If the average memory bandwidth numbers are close to the system bandwidth limit, optimization techniques for memory bound applications may be required to avoid memory stalls.
Vectorization: The percentage of packed (vectorized) floating point operations. The higher the value, the bigger the vectorized portion of the code. This metric does not account for the actual vector length used for executing vector instructions. As a result, if the code is fully vectorized, but uses a legacy instruction set that only utilizes a half of the vector length, the Vectorization metric is still equal to 100%.
I/O Operations: The time spent by the application while reading data from the disk or writing data to the disk. Read and Write values denote mean and maximum amounts of data read and written during the elapsed time. This metric is only available for MPI applications.
PCIe Metrics: indicate average bandwidth of inbound read and write operations initiated by PCIe devices. The data is shown for GPU and network controller devices.
Memory Footprint: Average per-rank and per-node consumption of both virtual and resident memory.
GPU Metrics: This collection of metrics contains metrics that enable you to analyze the efficiency of GPU utilization within your application. Using these metrics, you can check the portion of time when the GPU was busy with offload tasks, as well as get an insight into how well your execution units are utilized.
Documentation and Resources
Resource |
Description |
|---|---|
User forum dedicated to all Intel Performance Snapshot tools, including Application Performance Snapshot. |
|
Application Performance Snapshot product page. See this page for support and online documentation. |
|
Learn more about Application Performance Snapshot, including details on specific metrics and best practices for application optimization. |
Legal Information
Intel, the Intel logo, Intel Atom, Intel Core, Intel Xeon Phi, VTune and Xeon are trademarks of Intel Corporation in the U.S. and/or other countries.
*Other names and brands may be claimed as the property of others.
Microsoft, Windows, and the Windows logo are trademarks, or registered trademarks of Microsoft Corporation in the United States and/or other countries.
Copyright 2016-2019 Intel Corporation
This software and the related documents are Intel copyrighted materials, and your use of them is governed by the express license under which they were provided to you (License). Unless the License provides otherwise, you may not use, modify, copy, publish, distribute, disclose or transmit this software or the related documents without Intel's prior written permission.
This software and the related documents are provided as is, with no express or implied warranties, other than those that are expressly stated in the License.