Tutorial
Analyze MPI Applications with Intel® Trace Analyzer and Collector and Intel® VTune™ Profiler
ID
773180
Date
3/31/2023
Public
Detect Serialization in Function Profile and Message Profile
Continue the analysis of your application with information provided by other charts.
In the Function Profile chart, open the Load Balance tab.
Go to the Charts menu to open a Message Profile.
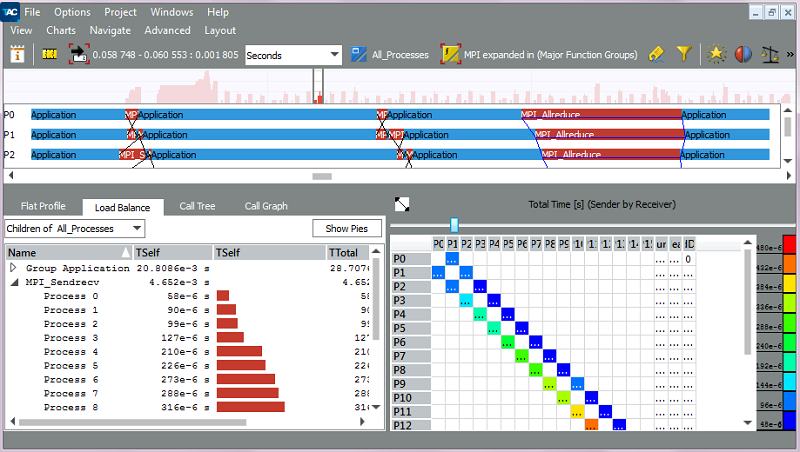
In the Load Balance tab, expand MPI_Sendrecv and MPI_Allreduce. The Load Balancing indicates that the time spent in MPI_Sendrecv increases with the process number, while the time for MPI_Allreduce decreases.
Examine the Message Profile Chart down to the lower right corner. The color coding of the blocks indicates that messages traveling from a higher rank to a lower rank need proportionally more time while the messages traveling from a lower rank to a higher rank reveal a weak even-odd kind of pattern.
Parent topic: Optimizing MPI Communications