Analyze the Most Active MPI Functions
Analyze an MPI application behavior, find bottlenecks and identify serialization to find the ways to improve the application performance.
From the Summary Page open the Event Timeline view by clicking Continue > Charts > Event Timeline for deep analysis of the top MPI functions.
The chart displays individual process activities over time.
Application work is iterative, where each iteration consists of a computational part and MPI communications.
Identify a single iteration to focus on and zoom into it by dragging your mouse over the required time interval:

The trace view shows the section within the trace that you selected. The Event Timeline chart shows the events that were active during the selected iteration.
Horizontal bars represent the processes with the functions called in these processes.
Black lines indicate messages sent between processes. These lines connect sending and receiving processes.
Blue lines represent collective operations, such as broadcast or reduce operations.
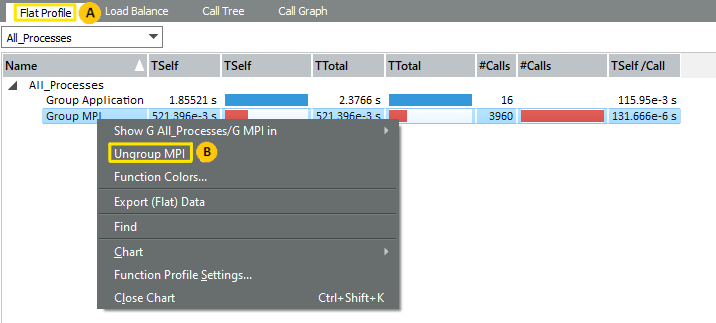
Switch to the Flat Profile tab (
 ) to have a closer look at functions executing in the time point you selected in the Event Timeline.
Ungroup MPI functions to analyze MPI process activity in your application.
To do this, right-click the All Processes > Group MPI (
 ) in the Flat Profile and choose Ungroup MPI. This operation exposes the individual MPI calls.
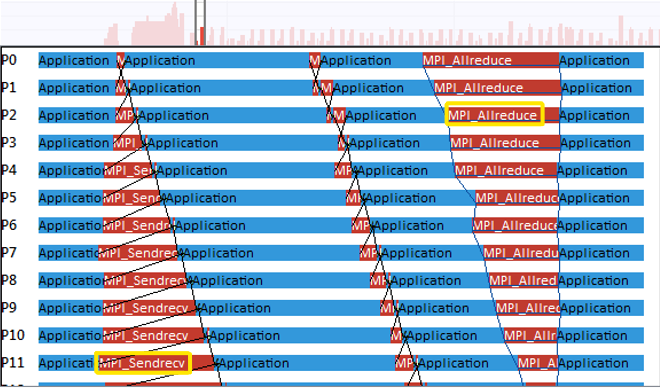
 Analyze the processes communicating with their direct neighbors using MPI_Sendrecv at the start of the iteration. For example:

In the sample, the MPI_Sendrecv data exchange has a bottleneck: the process does not exchange data with its next neighbor until the exchange with the previous one is complete.
The Event Timelines view displays this bottleneck as a staircase.
The MPI_Allreduce at the end of the iteration resynchronizes all processes; that is why this block has the reverse staircase appearance.
Identify serialization, using the Function Profile and Message Profile views.
Open the charts at the same time:
In the Function Profile chart, open the Load Balancetab.
Go to the Charts menu to open a Message Profile.
In the Load Balance tab, expand MPI_Sendrecv and MPI_Allreduce. The Load Balancing indicates that the time spent in MPI_Sendrecv increases with the process number, while the time for MPI_Allreduce decreases.
Examine the Message Profile Chart down to the lower right corner.
The color coding of the blocks indicates that messages traveling from a higher rank to a lower rank need proportionally more time while the messages traveling from a lower rank to a higher rank reveal a weak even-odd kind of pattern:

The results of the comparative analysis shows that there are no complex exchange patterns in the application, the exchange is carried out only with neighboring processes. The information will be essential for Improve Your Application Performance by Changing Communications step to optimize the communication model of the application.