View Energy Analysis Data with Intel® System Studio
View and analyze energy analysis data in the Intel System Studio graphical user interface.
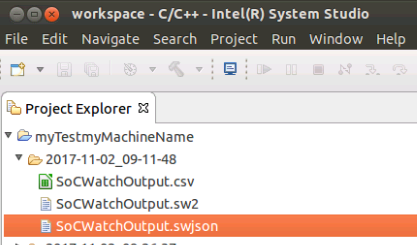
If you collected energy analysis data using Intel® SoC Watch or with an Energy Analysis project on a Linux* or Android* system, you can view the collected data in graphical format by opening a .swjson output file in the Intel System Studio graphical user interface. To open the result, double-click on the .swjson file in your project. Results open with the Summary tab active.
If you do not have results in the .swjson format, you can convert .sw2 result files using the following command:
> ./socwatch -i /home/results/result.sw2 -r json
Summary Tab
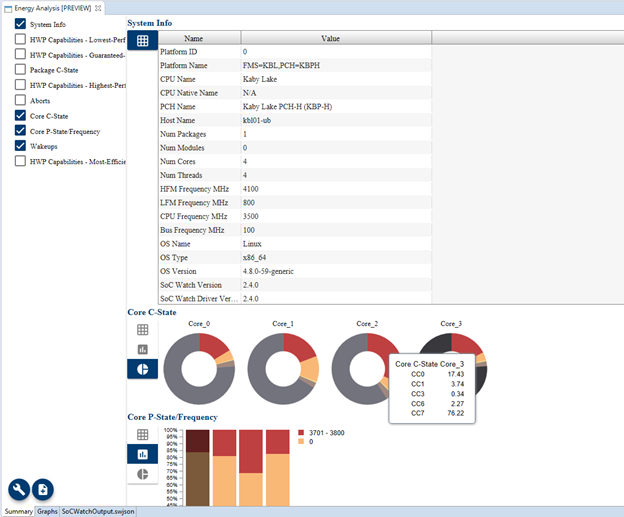
Select which metrics you are interested in using the checkboxes on the left.
Choose the type of graph for each metric using the options to the left of the current graph.
Hover over a graph to see a tooltip with details about the metrics for that graph.
Double-click a particular graph to view more details or click the Graphs tab at the bottom of the screen.
Graphs Tab
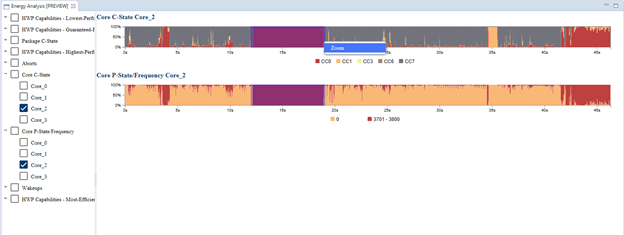
Select which metrics you are interested in using the checkboxes on the left. You can select by core, by metric, or both.
Zoom in on the timeline by clicking and dragging across the graph. All graphs are impacted by the zoom feature. You can reset the zoom by right-clicking on a graph and selecting Reset Zoom.
Hover over a graph to see a tooltip with additional details.
Compare Results
Open a result file, click the  icon, and browse to another result file for comparison. You can compare multiple *.swjson files.
View Analysis Types
Click the  icon to filter the analysis types shown based on the collected data. For example, the Thermal analysis allows you to specify a threshold to easily view time spent above and below that threshold in the data visualization.