A newer version of this document is available. Customers should click here to go to the newest version.
Interpret Energy Analysis Data with Intel® VTune™ Profiler
Identify causes of energy waste on target systems by opening your energy analysis results with Intel VTune Profiler.
After you collect energy analysis data on your target system, using the Intel® SoC Watch collector, you can import a result file (*.pwr ) to Intel® VTune™ Profiler on your host system. Energy analysis data is opened in the Platform Power analysis viewpoint.
To interpret the performance data provided during the energy analysis, you may follow the steps below:
Analyze Overall Statistics
Use the Summary window to view statistics on the overall collection run time execution per power analysis metrics. Viewing the top statistics and histograms for a particular metric is a good starting point. Focus on decreasing the causes of core wake-up and increasing the time that the core spends in the higher sleep states.
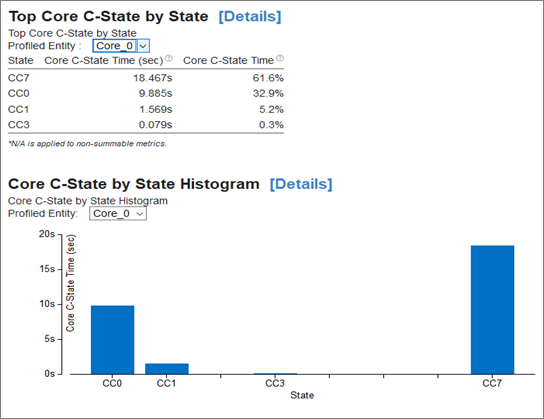
For example, this Top Core C-State by State diagram shows that the core was awake for approximately 10 seconds of the total collection time (time in CC0 state). Use the Profiled Entity drop-down to view the C-state data for other cores. Explore the histogram to analyze the time spent in each sleep state.
Click the Details link next to the table or graph title on the Summary tab to view more information about that metric in another tab.
Identify Cores with Highest Time Spent in C0 States
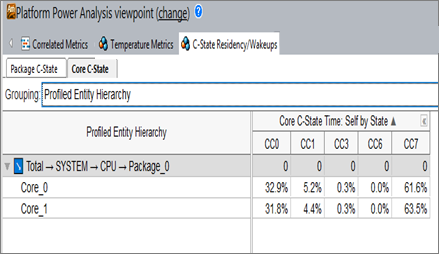
Switch to the C-State Residency/Wakeups window and the Core C-State tab to identify cores with the highest time spent in the active C0 state. Spending more time in deeper sleep states (C1-Cn) provides greater power savings.
By default, VTune Profiler displays data grouped by core and sorted by CPU time spent in the deepest C-state in the ascending order. For the example below, over 30% of the time was spent in the CC0 active state for both cores.
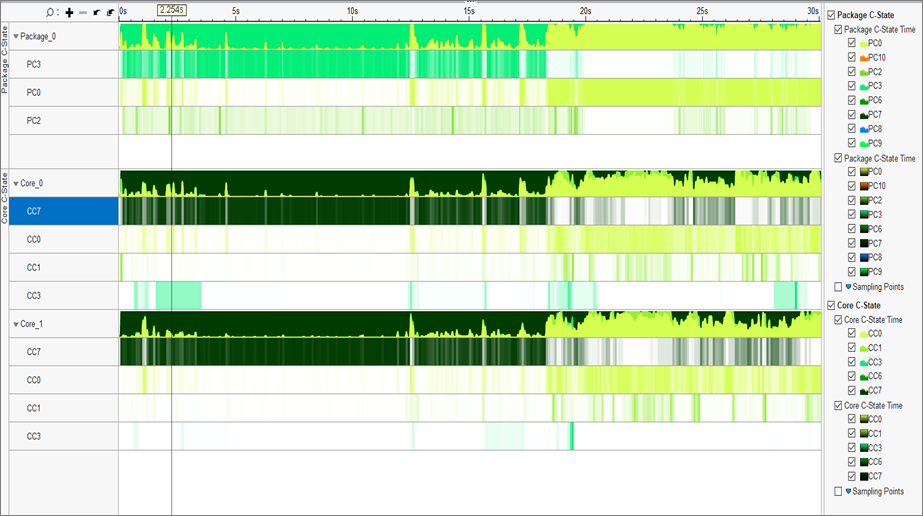
Use the timeline view to understand when state transitions occur. Hover over a chart point to view the sleep states details for the particular moment of time. The deeper the color of the chart, the deeper the sleep state of the CPU. Select a region of the graph and zoom into the selection to see detailed sleep state transitions.