Build and Run a Sample Project Using Visual Studio Code
Intel® HPC Toolkit
Intel® oneAPI toolkits integrate with third-party IDEs to provide a seamless GUI experience for software development.
An internet connection is required to download the samples for oneAPI toolkits. If you are using an offline system, download the samples from a system that is internet connected and transfer the sample files to your offline system. If you are using an IDE for development, you will not be able to use the oneAPI CLI Samples Browser while you are offline. Instead, download the samples and extract them to a directory. Then open the sample with your IDE. The samples can be downloaded from here:
Intel® oneAPI Toolkit Code SamplesThis procedure requires the Sample Browser extension to be installed. The next section will describe how to install it. If you have already installed it, skip to Create a Project Using Visual Studio Code.
Extensions for Visual Studio Code Users
To watch a video presentation of how to install extensions and use them to set up your environment, explore sample code, and connect to the Intel® Developer Cloud using Visual Studio Code, see oneAPI Visual Studio Code Extensions.
You can use VS Code extensions to set your environment, create launch configurations, and browse and download samples:
From Visual Studio Code, click on the Extensions logo in the left navigation.

- Locate the extension titled Sample Browser for Intel oneAPI Toolkits, or visit https://marketplace.visualstudio.com/publishers/intel-corporation to browse available extensions.
- Click Install.
- Next, locate the extension titled Environment Configurator for Intel oneAPI Toolkits.
- Click Install.
For more information about VS Code extensions for Intel oneAPI Toolkits, see Using Visual Studio Code* to Develop Intel® oneAPI Applications.
Create a Project Using Visual Studio Code
- Click on the oneAPI button on the left navigation to view samples.
To watch a video presentation of how to install extensions and use them to set up your environment, explore sample code, and connect to the Intel® Developer Cloud using Visual Studio Code, see oneAPI Visual Studio Code Extensions.

- A list of available samples will open in the left navigation.
- To view the readme for the sample, click the
 next to the sample. If you choose to build and run the sample, the readme will also be downloaded with the sample.
 - Find the sample you want to build and run. Click the
 to the right of the sample name.
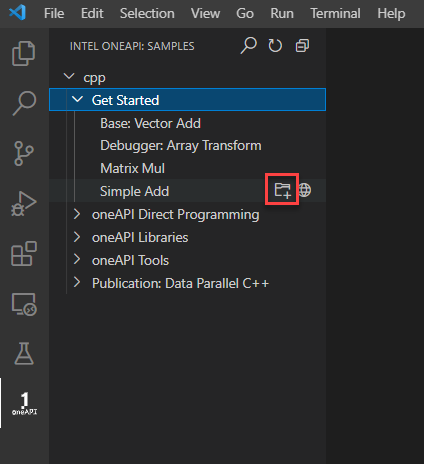
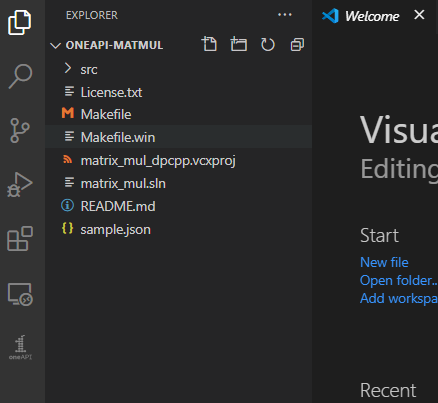
- Create a new folder for the sample. The sample will load in a new window:
Set the oneAPI Environment
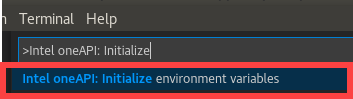
- Press Ctrl+Shift+P ( or View -> Command Palette… ) to open the Command Palette.
- Type Intel oneAPI: Initialize environment variables. Click on Intel oneAPI: Initialize environment variables.
- From the left navigation, click README.md to view instructions for the sample.
Prepare Build Tasks from Make / CMake Files
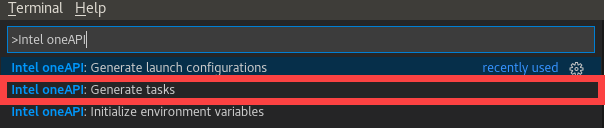
- Press Ctrl+Shift+P or View -> Command Palette… to open the Command Pallette.
- Type Intel oneAPI and select Intel oneAPI: Generate tasks.
Select the build tasks (target) from your Make/CMake oneAPI project that you want to use.
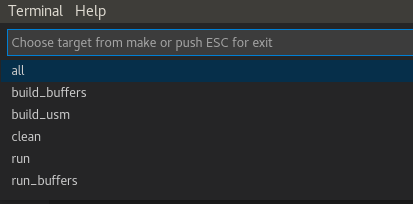
Run the task/target by selecting Terminal -> Run task... .
Select the task to run.
Build the Project
The oneAPI extensions enable the ability to prepare launch configurations for running and debugging projects created using Intel oneAPI toolkits:
- Press Ctrl+Shift+B or Terminal -> Run Build Task... to set the default build task.
- Select the task from the command prompt list to build your project.
- Press Ctrl+Shift+B or Terminal -> Run Build Task... again to build your project.
Prepare Launch Configuration for Debugging
To following section describes how to use the Intel oneAPI FPGA compiler with Visual Studio Code, and use your native debugger to debug device code in emulation.
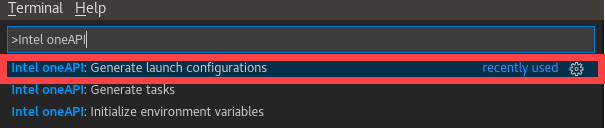
- Press Ctrl+Shift+P or View -> Command Palette... to open the Command Palette.
- Type Intel oneAPI and select Intel oneAPI: Generate launch configurations .
- Select the executable (target) you want to debug.
Optional: select any task you want to run before and/or after launching the debugger (for example, build the project before debug, clean the project after debug).
- The configuration is now available to debug and run using the gdb-oneapi debugger. You can find it in .vscode/launch.json. To debug and run, click on the Run icon or press Ctrl+Shift+D.
Using the Native Debugger to Debug Device Code in Emulation
The oneAPI extensions enable the ability to prepare launch configurations for running and debugging projects created using Intel oneAPI toolkits:
- Download and install the C/C++ extension for Visual Studio Code. You can search for it in the Extensions Marketplace, or download it from the repository
- Configure the C/C++ extension to see the oneAPI compiler's header files. To do this, open the Extensions tab, and click the little gear icon next to the C/C++ extension, then choose 'Extension Settings'. Adjust the Cpp Standard to c++17.
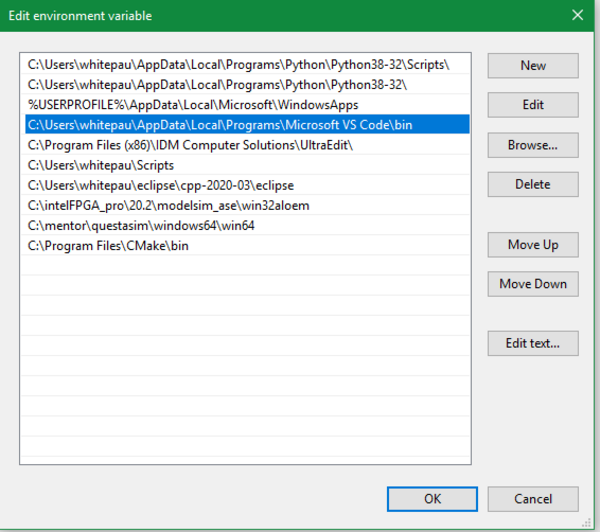
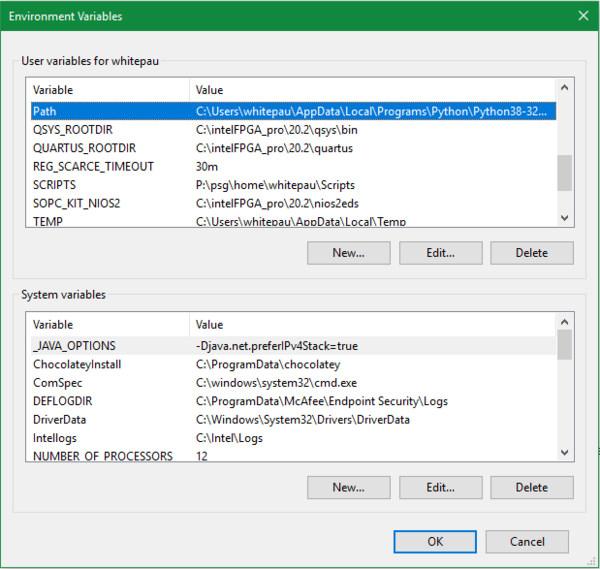
- Add Visual Studio Code to your PATH environment variable, so that you can call it from the command line:
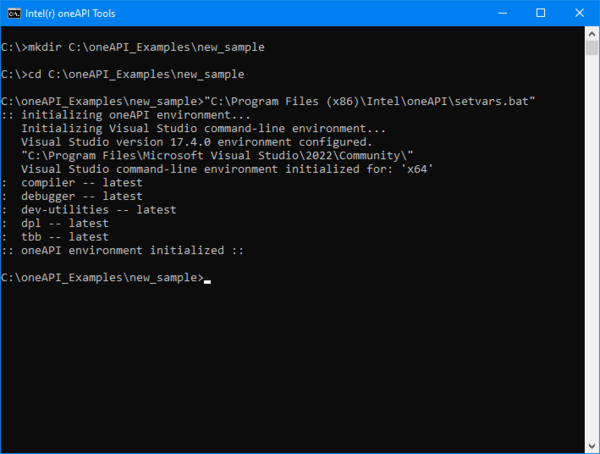
- Create a oneAPI project by creating a folder in your filesystem, then navigating to the folder using the command line and initializing the oneAPI compiler:
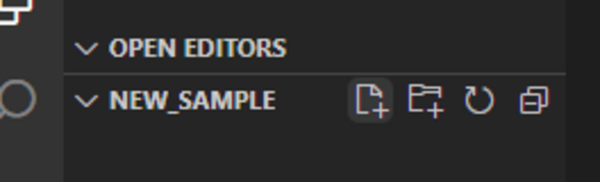
- Open VS Code in this directory using the code .. command. The Visual Studio debugger will not work properly if you do not launch VS code from a terminal like this. The visual Studio Code GUI should open. Create a new source file by clicking the 'new file' button by the project name:
Name it `test1.cpp`. Paste in this code (or write your own):
#include <iostream> // oneAPI headers #include <sycl/ext/intel/fpga_extensions.hpp> #include <sycl/sycl.hpp> // Forward declare the kernel name in the global scope. This is an FPGA best // practice that reduces name mangling in the optimization reports. class VectorAddID; struct VectorAdd { int *const a_in; int *const b_in; int *const c_out; int len; void operator()() const { for (int idx = 0; idx < len; idx++) { int a_val = a_in[idx]; int b_val = b_in[idx]; int sum = a_val + b_val; c_out[idx] = sum; } } }; constexpr int kVectSize = 256; int main() { bool passed = false; try { // Use compile-time macros to select either: // - the FPGA emulator device (CPU emulation of the FPGA) // - the FPGA device (a real FPGA) // - the simulator device #if FPGA_SIMULATOR auto selector = sycl::ext::intel::fpga_simulator_selector_v; #elif FPGA_HARDWARE auto selector = sycl::ext::intel::fpga_selector_v; #else // #if FPGA_EMULATOR auto selector = sycl::ext::intel::fpga_emulator_selector_v; #endif sycl::queue q(selector); auto device = q.get_device(); std::cout << "Running on device: " << device.get_info<sycl::info::device::name>().c_str() << std::endl; // declare arrays and fill them // allocate in shared memory so the kernel can see them int *a = sycl::malloc_shared<int>(kVectSize, q); int *b = sycl::malloc_shared<int>(kVectSize, q); int *c = sycl::malloc_shared<int>(kVectSize, q); for (int i = 0; i < kVectSize; i++) { a[i] = i; b[i] = (kVectSize - i); } std::cout << "add two vectors of size " << kVectSize << std::endl; q.single_task<VectorAddID>(VectorAdd{a, b, c, kVectSize}).wait(); // verify that c is correct passed = true; for (int i = 0; i < kVectSize; i++) { int expected = a[i] + b[i]; if (c[i] != expected) { std::cout << "idx=" << i << ": result " << c[i] << ", expected (" << expected << ") A=" << a[i] << " + B=" << b[i] << std::endl; passed = false; } } std::cout << (passed ? "PASSED" : "FAILED") << std::endl; sycl::free(a, q); sycl::free(b, q); sycl::free(c, q); } return passed ? EXIT_SUCCESS : EXIT_FAILURE; } - Compile and debug your oneAPI design by opening a terminal by clicking 'terminal > New Terminal'. This will open a terminal pane at the bottom of the VS Code GUI:
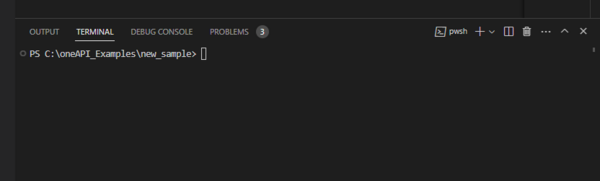
Click in the terminal area and press the 'enter' key to activate the terminal. If you opened VS code from a command line as described in step 3 above, you should see the oneAPI prompt. If you opened the GUI by any other means, you will need to initialize the oneAPI compiler using the set_vars.bat script.
Compile your source code using the icx-cl command (Be sure to include the debug flags /DEBUG /Od!): icx-cl -fsycl -fintelfpga /DEBUG /Od /EHsc test1.cpp -o fpga_emu.exe
If you are compiling a code sample, the debug flags will be generated for you by CMake.
mkdir build
cd build
cmake .. -G "NMake Makefiles" -DCMAKE_BUILD_TYPE=Debug
nmake fpga_emu
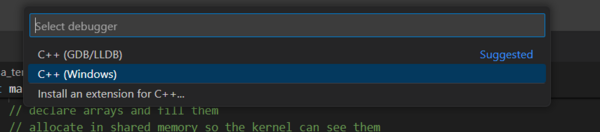
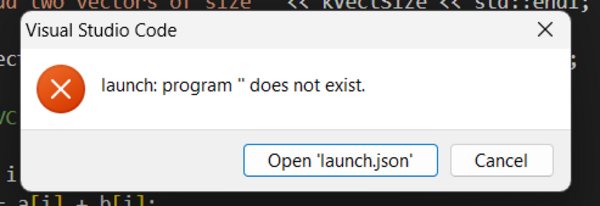
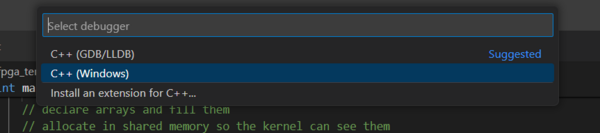
- You can launch the debugger by pressing 'F5' on your keyboard, or by clicking the 'Run' button in the GUI. The first time you try to debug an application, you will be prompted to create a launch.json file. To do this, select the C++ (Windows) environment in the dropdown:
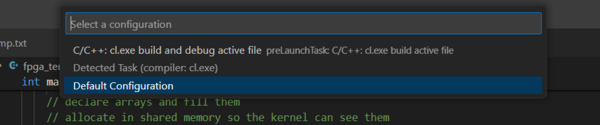
Then choose default configuration:
You will be prompted to open the Launch.json file:
Choose the type as C++ (Windows):
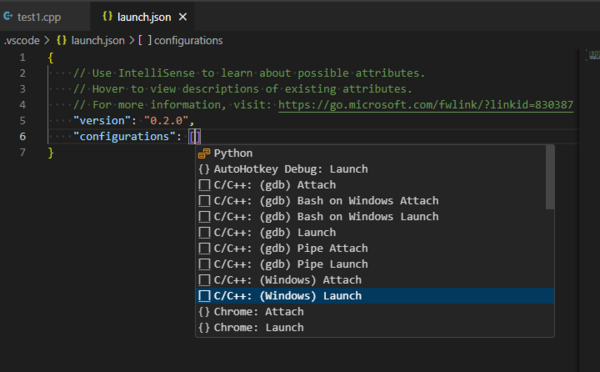
In the new 'launch.json', place your cursor between the [] and press ctrl + spacebar to get a prompt, and choose the 'Windows Launch' template:
Specify the program member to point to your compiled executable that you would like to debug. Save the launch.json, then close it.
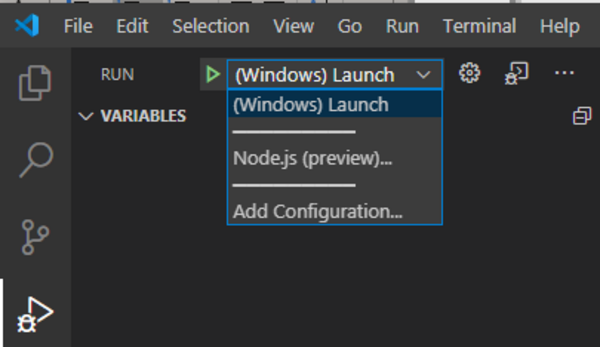
Make sure that (Windows) Launch is selected in the Run bar, and click the green 'start' arrow:
The debugger will automatically stop at any breakpoints that you have set in your code. you can inspect your variables and step through the code as you would with any GUI-based debugger.
Debug, Analyze, Develop with More Extensions
There are more oneAPI extensions for Visual Studio Code which enable:
- debugging
- remote development
- connection to Intel Developer Cloud
- analysis configuration
To learn more about the extensions, see Intel® oneAPI Extensions for Visual Studio Code*.
To learn more about more capabilities and options, see Using Visual Studio Code with Intel® oneAPI Toolkits.