Build and Run a Sample Project Using Visual Studio Code
Intel® oneAPI Base Toolkit
Intel® oneAPI toolkits integrate with third-party IDEs to provide a seamless GUI experience for software development.
To see a list of components that support CMake, see Use CMake to with oneAPI Applications .
To watch a video presentation of how to install extensions and use them to set up your environment, explore sample code, and connect to the Intel® Developer Cloud using Visual Studio Code, see oneAPI Visual Studio Code Extensions.
This procedure requires the Sample Browser extension to be installed. The next section will describe how to install it. If you have already installed it, skip to Create a Project Using Visual Studio Code.
Extensions for Visual Studio Code Users
To watch a video presentation of how to install extensions and use them to set up your environment, explore sample code, and connect to the Intel® Developer Cloud using Visual Studio Code, see oneAPI Visual Studio Code Extensions.
You can use VS Code extensions to set your environment, create launch configurations, and browse and download samples:
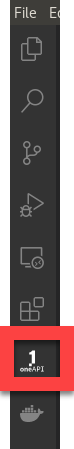
From Visual Studio Code, click on the Extensions logo in the left navigation.

- Locate the extension titled Sample Browser for Intel oneAPI Toolkits, or visit https://marketplace.visualstudio.com/publishers/intel-corporation to browse available extensions.
- Click Install.
- Next, locate the extension titled Environment Configurator for Intel oneAPI Toolkits.
- Click Install.
For more information about VS Code extensions for Intel oneAPI Toolkits, see Using Visual Studio Code* to Develop Intel® oneAPI Applications.
Create a Project Using Visual Studio Code
- Click on the icon to open the oneAPI Samples Browser:
- A list of available samples will open in the left navigation.
- To view the readme for the sample, click the
 next to the sample. If you choose to build and run the sample, the readme will also be downloaded with the sample.
 - Find the sample you want to build and run. Click the
 to the right of the sample name.
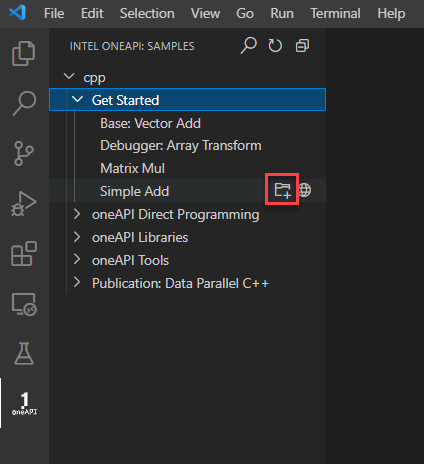
- Create a new folder for your sample and click OK.
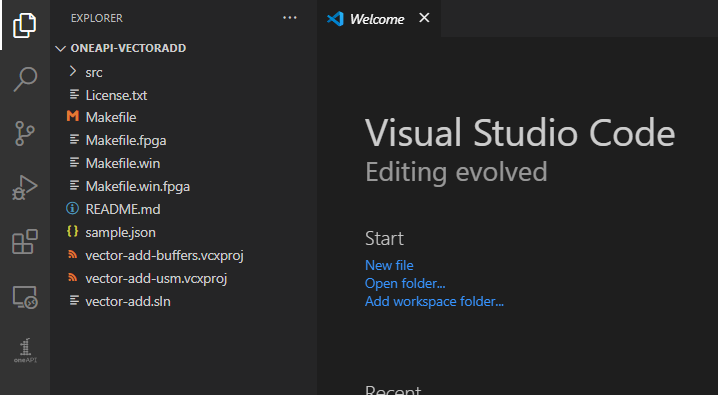
- The sample will load in a new window:
Set the oneAPI Environment
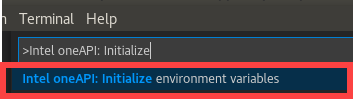
- Press Ctrl+Shift+P ( or View -> Command Palette… ) to open the Command Palette.
- Type Intel oneAPI: Initialize environment variables. Click on Intel oneAPI: Initialize environment variables.
Prepare Build Tasks from Make / CMake Files
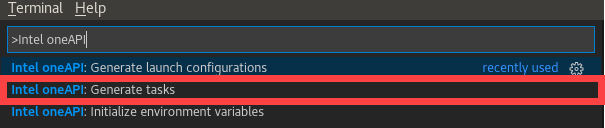
- Press Ctrl+Shift+P or View -> Command Palette… to open the Command Pallette.
- Type Intel oneAPI and select Intel oneAPI: Generate tasks.
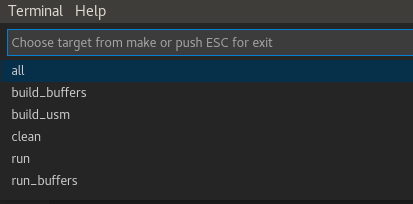
Select the build tasks (target) from your Make/CMake oneAPI project that you want to use.
Run the task/target by selecting Terminal -> Run task... .
Select the task to run.
Build the Project
The oneAPI extensions enable the ability to prepare launch configurations for running and debugging projects created using Intel oneAPI toolkits:
- Press Ctrl+Shift+B or Terminal -> Run Build Task... to set the default build task.
- Select the task from the command prompt list to build your project.
- Press Ctrl+Shift+B or Terminal -> Run Build Task... again to build your project.
Prepare Launch Configuration for Debugging
The oneAPI extensions enable the ability to prepare launch configurations for running and debugging projects created using Intel oneAPI toolkits:
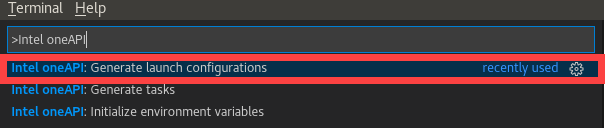
- Press Ctrl+Shift+P or View -> Command Palette... to open the Command Palette.
- Type Intel oneAPI and select Intel oneAPI: Generate launch configurations .
- Select the executable (target) you want to debug.
Optional: select any task you want to run before and/or after launching the debugger (for example, build the project before debug, clean the project after debug).
- The configuration is now available to debug and run using the gdb-oneapi debugger. You can find it in .vscode/launch.json. To debug and run, click on the Run icon or press Ctrl+Shift+D.
Debug, Analyze, Develop with More Extensions
There are more oneAPI extensions for Visual Studio Code which enable:
- debugging
- remote development
- connection to Intel Developer Cloud
- analysis configuration
To learn more about the extensions, see Intel® oneAPI Extensions for Visual Studio Code*.
To learn more about more capabilities and options, see Using Visual Studio Code with Intel® oneAPI Toolkits.
An internet connection is required to download the samples for oneAPI toolkits. If you are using an offline system, download the samples from a system that is internet connected and transfer the sample files to your offline system. If you are using an IDE for development, you will not be able to use the oneAPI CLI Samples Browser while you are offline. Instead, download the samples and extract them to a directory. Then open the sample with your IDE. The samples can be downloaded from here:
Intel® oneAPI Toolkit Code Samples