A newer version of this document is available. Customers should click here to go to the newest version.
Window: Collection Log
During Analysis
The Intel InspectorCollection Log window shows analysis progress indicators and analysis milestones, such as when application execution ends, finalization begins and ends, and analysis is complete. It also shows analysis warnings and suggestions on how to address those warnings. Use this window to:
Confirm the application is still executing (thread activity columns are resizable).
Check analysis duration.
Check memory consumption of the target application plus the Intel Inspector.
View finalization progress.
Track analysis milestones and address analysis warnings.
View suppression summary statistics.
Measure memory growth during a specific time period.
Search for new memory leaks during a specific time period.
Stop inspecting the application for issues, finalize the result collected thus far, open a new result tab, and display the result.
Stop inspecting the application for issues, finalize the result collected thus far, but close the new result tab. (You can open and display the result at a later date.)
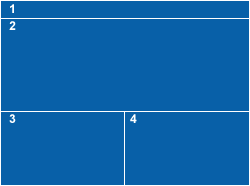
Window Layout
|
Window Panes and Toolbars |
After Analysis is Complete
To access this window: Click the Collection Log button on the Navigation toolbar.
Use this window to:
Review analysis informational, warning, and error messages.
Re-inspect - run another analysis using the same analysis type as that in the current result.
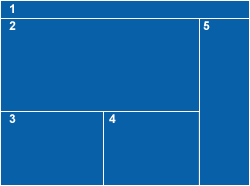
Window Layout
|
Window Panes and Toolbars |