How to get Kernel Backtrace
Since kernel version 3.7 with the new modeset code we have a lot more self-checks in the code. If one of these checks fail it will result in a backtrace in dmesg. The good thing is that even really small issues in the code can be caught much earlier (often before it negatively affects the end user experience), the downside is that we'll hit many more call trace issues in testing. To make handling these issues more efficient below are a few BKMs. The most important step is to figure out which kind of call trace (or backtrace) it is:
1- Bug Backtrace
Those come in two forms:
- One line BUG_ON warning like "BUG:at drivers/gpu/drm/i915/intel_display.c:7867intel_modeset_check_state+0x33c/0x5b9[i915]()" with source file and line + the hex offset of the crashing function. When reporting such a bug please put that exact line into the subject for the initial report (developers might change it later on to something more descriptive).
- BUG that does not have a function name in the first line, like "BUG:unable to handle kernel NULL pointer dereference atvirtualaddress00000008". To make the bug headline more descriptive please also add the name of the crashing function, it usually looks like "EIPisat acpi_ns_internalize_name+0xd/0x83" or "IP:EIPisat acpi_ns_internalize_name+0xd/0x83 ".
BUGs will stop the current thread, so usually there's not a following call trace. In any case, all subsequent call traces are most likely issues that occur right after the main bug and those traces can be safely ignored.
2- Warning Backtrace
These start with something like "WARNING: at drivers/gpu/drm/i915/intel_display.c:7867 intel_modeset_check_state+0x33c/0x5b9 [i915]()".
For the normal WARNING, it is best to just report the very first line with source file, line number and function. But there are a few subcases of WARNINGs which need special care.
2.A- Warning With Additional Information Line
Some WARNING backtraces also dump an additional info line like:
[ 34.104233] [ cut here ] [ 34.104252] WARNING: at drivers/gpu/drm/i915/intel_display.c:7839 intel_modeset_check_state+0x33c/0x5b9 [i915]() [ 34.104253] Hardware name: 2012 Client Platform [ 34.104254] encoder's hw state doesn't match sw tracking (expected 1, found 0) [ 34.104274] Modules linked in: ipv6 dm_mod acpi_cpufreq coretemp kvm_intel kvm microcode pcspkr i2c_i801 snd_hda_codec_realtek iTCO_wdt iTCO_vendor_support snd_hda_intel firewire_ohci lpc_ich snd_hda_codec firewire_core mfd_core snd_hwdep crc_itu_t snd_pcm snd_page_alloc shpchp snd_timer snd soundcore i915 video button drm_kms_helper drm mperf freq_table
Here is the third line (between "Hardware name:" and "Modules linked in:" lines) is the important one. So please use it when reporting such a call trace like "WARNING: encoder's hw state doesn't match sw tracking(expected1,found0)intel_modeset_check_state+0x33c/0x5b9". Adding the function name is useful to see the context of the warning at a quick glance. Note that some BUG backtraces also have this info line, they should be handled similarly.
2.B- Warning From The Modeset Pipe Config Checker
In kernel 3.10 we've added even more detailed modeset check code but in that code any mismatch will result in the same "pipe state doesn't match!" WARNING. Right before that line there should be an *ERROR* which has more details. Example:
[ 6.769026] [drm:intel_pipe_config_compare] *ERROR* mismatch in adjusted_mode.flags (expected 1, found 0) [ 6.769026] [ cut here ] [ 6.769049] WARNING: at drivers/gpu/drm/i915/intel_display.c:8186 intel_modeset_check_state+0x904/0x94b [i915]() [ 6.769049] pipe state doesn't match! [ 6.769055] Modules linked in: i915(+) drm_kms_helper drm video button dm_mirror dm_region_hash dm_log dm_mod ipv6 [ 6.769058] CPU: 0 PID: 1427 Comm: systemdudevd Not tainted 3.10.0rc2_drmintelnextqueued_92d446_20130603_+ #3325 [ 6.769059] Hardware name: Apple Inc. MacBookPro10,2/MacAFD8A9D944EA4843, BIOS MBP102.88Z.0106.B03.1211161133 11/16/2012 [ 6.769062] ffffffff816de142 0000000000000000 ffffffff8102c67d ffff880262bb93a0 [ 6.769064] ffff880262bb93a8 0000000000000001 ffff880264797000 ffff880262af0800 [ 6.769065] ffff8802647976c8 ffff880262670000 ffffffff8102c72d ffffffffa0134caf [ 6.769066] Call Trace: [ 6.769072] [<ffffffff816de142>] ? dump_stack+0xd/0x17 [ 6.769075] [<ffffffff8102c67d>] ? warn_slowpath_common+0x5f/0x77 [ 6.769077] [<ffffffff8102c72d>] ? warn_slowpath_fmt+0x45/0x4a [ 6.769098] [<ffffffffa00fbd74>] ? intel_modeset_check_state+0x904/0x94b [i915] [ 6.769116] [<ffffffffa00fbe2b>] ? intel_set_mode+0x1d/0x27 [i915] ...
When filing such a backtrace please use the following template for the headline
"WARNING: pipe state mismatch:<reason>fromthe*ERROR*line"
So for the example
"WARNING: pipe state mismatch:mismatchinadjusted_mode.flags(expected1,found0)"
The above calltrace introduction is only for when the calltrace is the main issue indicator, if something else goes wrong (machine hardhangs or an automated test fails) that's more important and should be the headline (with a "with calltrace" note added). When verifying and there are still calltraces in dmesg it's important to verify whether it's still the same one. If the info line (or the preceding *ERROR*) have changed, it's a different one (so should be filed as a new bug). However, if the info line/*ERROR* (if available) and the function name are the same and only the line changed, it means that it is the same calltrace issue.
Developers will make sure that for calltraces without further information (i.e. no debug info line) the function name uniquely identifies the backtrace for a WARNING (BUGs might be different) by placing at most one WARNING without debug info per function.
3- Pasting Kernel Backtrace
For kernel bugs with a backtrace in dmesg it's often useful to paste the backtrace into a comment in bugzilla for a quick overview. There's a lot of other important information before the section starting with "Calltrace" though (in most cases this stuff is more important than the call trace itself). Unfortunately there's often no clear start marker for the interesting stuff, so I think as a rule of thumb everything 12 seconds before the calltrace should be included. Also, as a general rule only the very first backtrace is important, all the later ones are usually just follow-up issues.
If the machine hangs and you can't get at the backtrace with logs or netconsole it will (hopefully) get printed onto the screen. Please take a picture with a camera. To make reading such an oops or panic easy please make sure the picture is sharp all across the screen and that the picture is taken parallel to the screen.
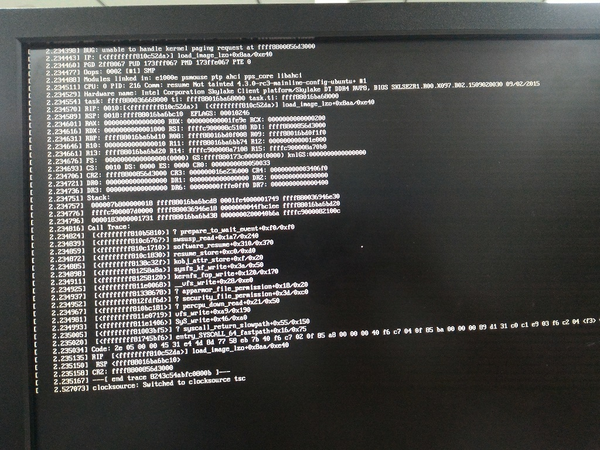
Unfortunately it often scrolls off the screen, especially if multiple backtraces show up. If this is the case please boot with pause_on_oops=60 so that the kernel waits 1 minute after the first oops before printing the next one (or generally continuing). Sometimes even just one backtrace is too large, setting boot_delay=100 might help in this case, it should slow down the output (so that you can take multiple pictures and stitch it together).