Prototype Threading Designs
With the Threading perspective, you can identify the best candidates for parallelizing, prototype threading and check, if there are data dependencies preventing parallelizing of certain functions/loops.
This page explains how to profile nqueens application and choose the best candidates for parallelization with threads. You can also use your own application to follow the instructions below.

Follow the steps:
Prerequisites
- Install the Intel Advisor as a standalone or as part of Intel® oneAPI Base Toolkit. For installation instructions, see Install Intel Advisor in the user guide.
- Install the Intel® C++ Compiler Classic as a standalone or as part of Intel® HPC Toolkit. For installation instructions, see Intel® oneAPI Toolkits Installation Guide.
- Set up environment variables for the Intel Advisor and Intel® C++ Compiler Classic. For example, run the setvars script in the installation directory.
This document assumes you installed the tools to a default location. If you installed the tools to a different location, make sure to replace the default path in the commands below.
IMPORTANT:Do not close the terminal or command prompt after setting the environment variables. Otherwise, the environment resets.
Unpack and Build Your Application
On Linux* OS
From the terminal where you set the environment variables:
- Go to the /opt/intel/oneapi/advisor/latest/samples/en/C++ directory.
- Copy the nqueens_Advisor.tgz file to a writable directory or share on your system.
- Extract the sample from the .tgz file.
- Change directory to the nqueens_Advisor/ directory in its unzipped location.
- Build the sample application:
make 1_nqueens_serial - Run the application to verify the build:
./1_nqueens_serialThe application output window displays a board size of 14 and the total time it took to run the target.
On Windows* OS (From Command Line)
- Find Visual Studio Tools for your Microsoft Visual Studio* and OS version, and select one of the command prompt shortcuts. For example, from the Microsoft Windows* 10 Start pane, select Visual Studio 2019 > x64 Native Tools Command Prompt for VS2019.
- Go to the C:\Program Files (x86)\Intel\oneAPI\advisor\latest\samples\en\C++ directory.
- Copy the nqueens_Advisor.zip file to a writable directory or share on your system.
- Extract the sample from the.zip file.
- Change directory to the nqueens_Advisor/ directory in its unzipped location.
- Build the target in release mode:
devenv nqueens_Advisor.sln /build release /project 1_nqueens_serial - Change directory to the Release directory.
- Run the application to verify the build:
1_nqueens_serial.exeThe application output window displays a board size of 14 and the total time it took to run the target.
On Windows* OS (From Microsoft Visual Studio)
- Go to the C:\Program Files (x86)\Intel\oneAPI\advisor\latest\samples\en\C++ directory.
- Copy the nqueens_Advisor.zip file to a writable directory or share on your system.
- Extract the sample from the .zip file.
- Launch the Microsoft Visual Studio IDE.
- Choose File > Open > Project/Solution....
- In the Open Project dialog box, navigate to the nqueens_Advisor/ directory in its unzipped location and open the nqueens_Advisor.sln file.
NOTE:If you get a dialog window suggesting you to retarget the application, click OK.
- If the Solutions Configuration drop-down is set to Debug, change it to Release.
- Right-click the 1_nqueens_serial project in the Solution Explorer and Choose Set as Start Up Project.
- If you want to use the Intel® C++ Compiler Classic, right-click the 1_nqueens_serial project and click Intel Compiler > Use Intel C++ Compiler Classic.
- Right-click the 1_nqueens_serial project, then choose Properties to verify the sample code uses the optimal release build settings.
For details about recommended build setting, see Build Target Application.
- Click the OK button to close the Properties dialog box.
- Choose Build > Clean Solution.
- Choose Build > Build 1_nqueens_serial to build the target.
The application output window displays a board size of 14 and the total time it took to run the target.
- If the Visual Studio* IDE responds that any projects are out of date, click No to not build them.
Collect Baseline Performance Data
Run Threading Perspective from Graphical User Interface (GUI)
- From the terminal or command prompt where you set the environment variables, launch the Intel Advisor GUI:
advisor-gui - Create a project for the just-built vec_samples application. For details, see Before You Begin.
When in the Project Properties dialog box, make sure the Inherit settings from Survey Hotspots Analysis Type checkbox is selected in the Trip Counts and FLOP Analysis, Dependencies Analysis, and Memory Access Patterns Analysis types.
NOTE:If you work in the Microsoft Visual Studio IDE, you do not need to create a project as the Intel Advisor creates it automatically when you first open the Intel Advisor GUI. - From the Perspective Selector pane, choose the Threading perspective.
- In the Analysis Workflow pane, set data collection accuracy level to Low, and click the
 button to run the perspective.
 At this accuracy level, Intel Advisor runs Survey analysis to profile the application.
Run Threading from Command Line Interface (CLI) on Linux OS
Run Survey analysis to collect performance metrics and identify loops/functions with the longest total time:
advisor --collect=survey --project-dir=./1_nqueens_serial --search-dir src:r=./1_nqueens_serial -- 1_nqueens_serialWhen the analysis execution completes, the 1_nqueens_serial project is created automatically, which includes the Vectorization and Code Insights results. You can view them from Intel Advisor GUI.
Run Threading from CLI on Windows OS
Run Survey analysis to collect performance metrics and identify loops/functions with the longest total time:
advisor --collect=survey --project-dir=./1_nqueens_serial --search-dir src:r=./1_nqueens_serial -- 1_nqueens_serial.exeWhen the analysis execution completes, the 1_nqueens_serial project is created automatically, which includes the Vectorization and Code Insights results. You can view them from Intel Advisor GUI.
Examine Results to Find Opportunities for Parallelization
If you collect data using GUI, Intel Advisor automatically opens the results when the collection completes.
If you collect data using CLI, open the results in GUI using the following command:
advisor-gui ./1_nqueens_serialIf the result does not open automatically, click Show Result.
When you open the Vectorization and Code Insights result in GUI, Intel Advisor shows the Summary tab first. This window is a dashboard containing the main information about application execution, performance hints, and indication of vectorization problems in your application.
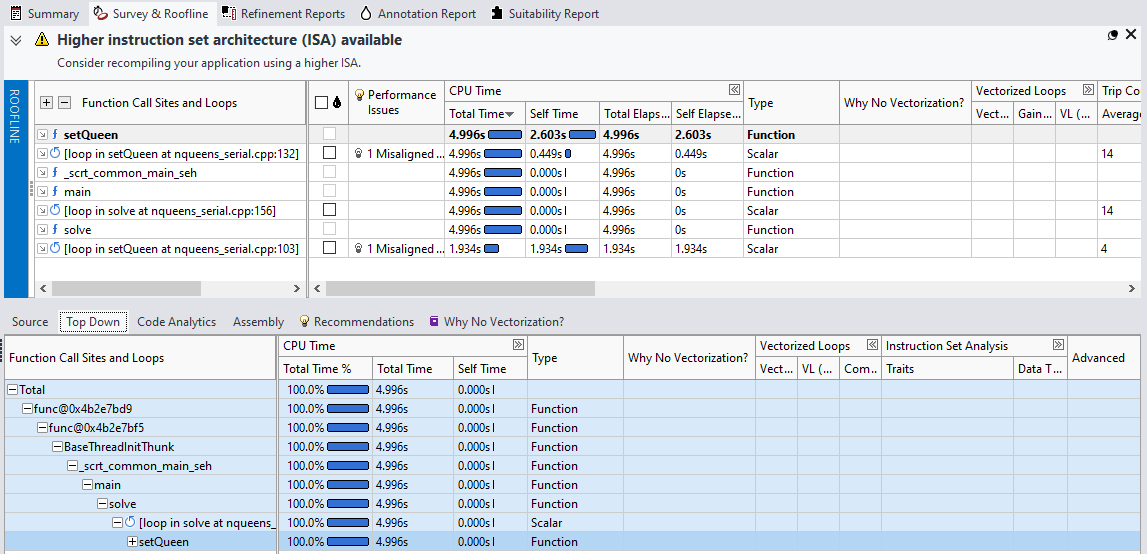
Switch to the Survey & Roofline to examine performance metrics for each loop/function and find the candidates for parallelization.

In the bottom pane of the Survey & Roofline report, click Top Down on the navigation toolbar to investigate functions/loops in hierarchy.
- The Total Time column shows the time spent in a function or loop and all functions called from it. A row with a large Total Time % and multiple children with smaller total times are possible candidates for parallelism.
- The Self Time column shows how much time was spent in each function or loop each time in was called. Loops or functions with significant self time values are possible candidates for distributing work.
- The application spends the most time in the setQueen() function and calls itself recursively. This function is the parallelization candidate.
Mark Best Parallel Opportunities with Annotations
Annotations are subroutine calls or macro uses that you can use to mark places in serial parts of your program where Intel Advisor should assume your program's parallel execution and synchronization will occur. The annotations do not change the computations of your program, so your application runs normally.
- Open the application source code nqueens_serial.cpp in your preferred editor.
- Search for ADVISOR SUITABILITY EDIT and follow the directions in the sample code. Make four total edits to annotate the code:
- Uncomment #include <advisor-annotate.h>. This file is the include file that defines the annotations.
- Uncomment ANNOTATE_SITE_BEGIN(solve);. This annotation marks the start of a parallel site that contains a single task in a loop.
- Uncomment ANNOTATE_ITERATION_TASK(setQueen);. This annotation marks an iterative parallel task in a loop.
- Uncomment ANNOTATE_SITE_END();. This annotation marks an end of a parallel site.
- Save your edits and close the editor.
- Rebuild the target.
NOTE:If the build fails due to the include file not found and undefined identifiers:
- Go to Project > 1_nqueens_setial Properties.
- In the C/C++ > Additional Include Directories, change the Intel Advisor year version to the version installed on your machine. For example, ADVISOR_2022_DIR.
Model Threading Parallelism
Re-run the Threading perspective with additional analyses. Do one of the following:
Run Threading from GUI
- In the Analysis Workflow pane, select the Medium accuracy level to configure the perspective automatically.
- Click the
 button to run the perspective.
 At this accuracy level, Intel Advisor runs Survey, Characterization with trip counts, Suitability, and Dependencies analyses.
IMPORTANT:If you get the Your configuration might be incomplete message, click Continue. This warning message reminds you to make sure you have added annotations to your source code because Suitability and Dependencies analyses cannot run without them.
Run Threading from CLI on Linux OS
- Run the Survey analysis to analyze performance.
advisor --collect=survey --project-dir=./1_nqueens_serial --search-dir src:r=./1_nqueens_serial -- 1_nqueens_serial - Collect trip counts data.
advisor --collect=tripcounts --project-dir=./1_nqueens_serial --search-dir src:r=./1_nqueens_serial -- 1_nqueens_serial - Model threading designs for the annotated functions/loops with the Suitability analysis.
advisor --collect=suitability --project-dir=./1_nqueens_serial --search-dir src:r=./1_nqueens_serial -- 1_nqueens_serial - Identify data sharing problems that might prevent annotated functions/loops from parallelizing with the Dependencies analysis:
advisor --collect=dependencies --project-dir=./1_nqueens_serial --search-dir src:r=./1_nqueens_serial -- 1_nqueens_serial
Run Threading from CLI on Windows OS
- Run the Survey analysis to analyze performance.
advisor --collect=survey --project-dir=./1_nqueens_serial --search-dir src:r=./1_nqueens_serial -- 1_nqueens_serial.exe - Collect trip counts data.
advisor --collect=tripcounts --project-dir=./1_nqueens_serial --search-dir src:r=./1_nqueens_serial -- 1_nqueens_serial.exe - Model threading designs for the annotated functions/loops with the Suitability analysis.
advisor --collect=suitability --project-dir=./1_nqueens_serial --search-dir src:r=./1_nqueens_serial -- 1_nqueens_serial.exe - Identify data sharing problems that might prevent annotated functions/loops from parallelizing with the Dependencies analysis:
advisor --collect=dependencies --project-dir=./1_nqueens_serial --search-dir src:r=./1_nqueens_serial -- 1_nqueens_serial.exe
Examine the Results
If you collect data using GUI, Intel Advisor automatically opens the results when the collection completes.
If you collect data using CLI, open the results in GUI using the following command:
advisor-gui ./1_nqueens_serialIf the result does not open automatically, click Show Result.
When the Threading report opens, examine the application performance modeled with parallelism.
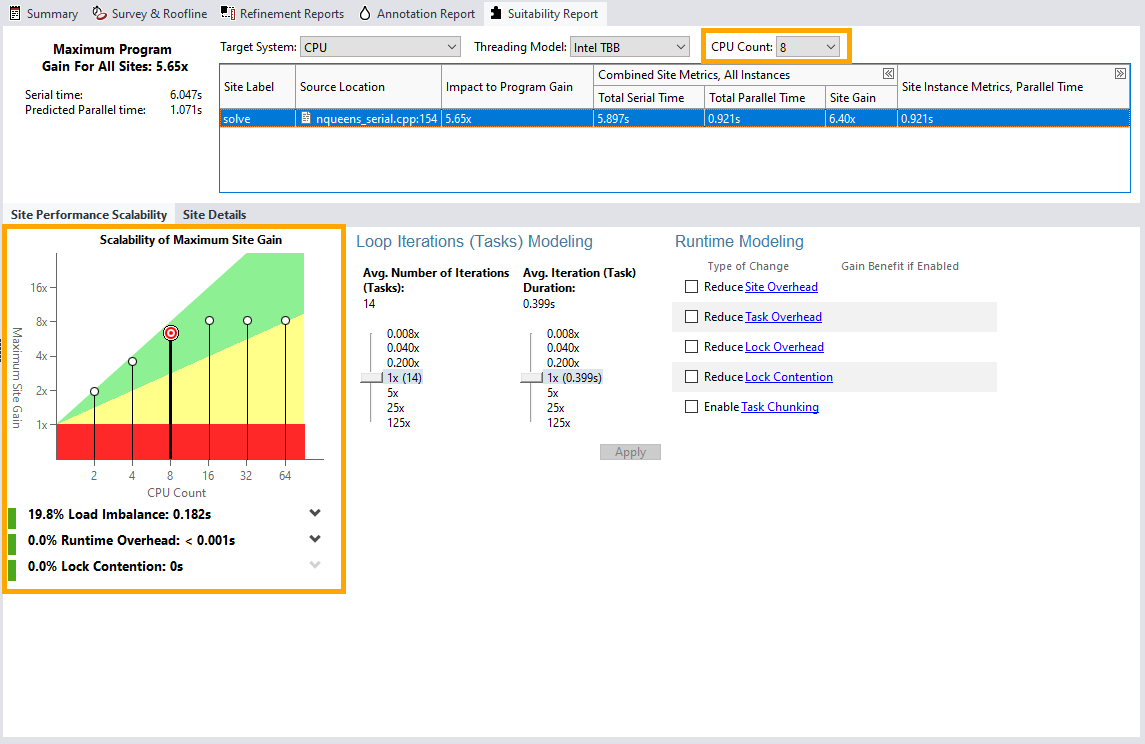
- Go to the Suitability report tab to examine how parallelization can improve the performance:
- For the annotated loop at nqueens_serial.cpp:154, the Intel Advisor predicts the performance speedup around 1.80x for default configuration parameters.
- As the Scalability of Maximum Site Gain diagram shows, for CPU count from 2 to 16, the performance speedup increases. For the CPU count higher that 16, the performance speedup is the same, because the corresponding bull-eye dots are on the same line. Most of the dots on the diagram are located in the green zone, but from the 16 CPU, the higher the CPU count, the closer it is to the yellow zone. This means that the predicted speedup is worth an effort if you parallelize the loop for up to 16 CPUs. Parallelizing the loop to run on more than 16 CPUs might require more time and/or effort, but will result in the same speedup and might cause performance issues.

- Examine the three percentage metrics below the diagram. Notice that for the default CPU count of 8, the metrics are all green, which means that there are no performance issues. You are recommended to parallelize the loop for up to 8 CPUs to achieve optimal performance.
- Change the CPU Count to 16 to see the details about the predicted performance for this case. Notice that the corresponding dot is located closer to the yellow zone that the dots on the left from it. The Load Imbalance metric is yellow and is around 44%. The high load imbalance causes the predicted maximum speedup to be not enough to justify the effort needed to refactor your application. Consider investigating to understand how to optimize it.
- Experiment with the CPU count, threading model, and other parameters to see how they might affect the performance.
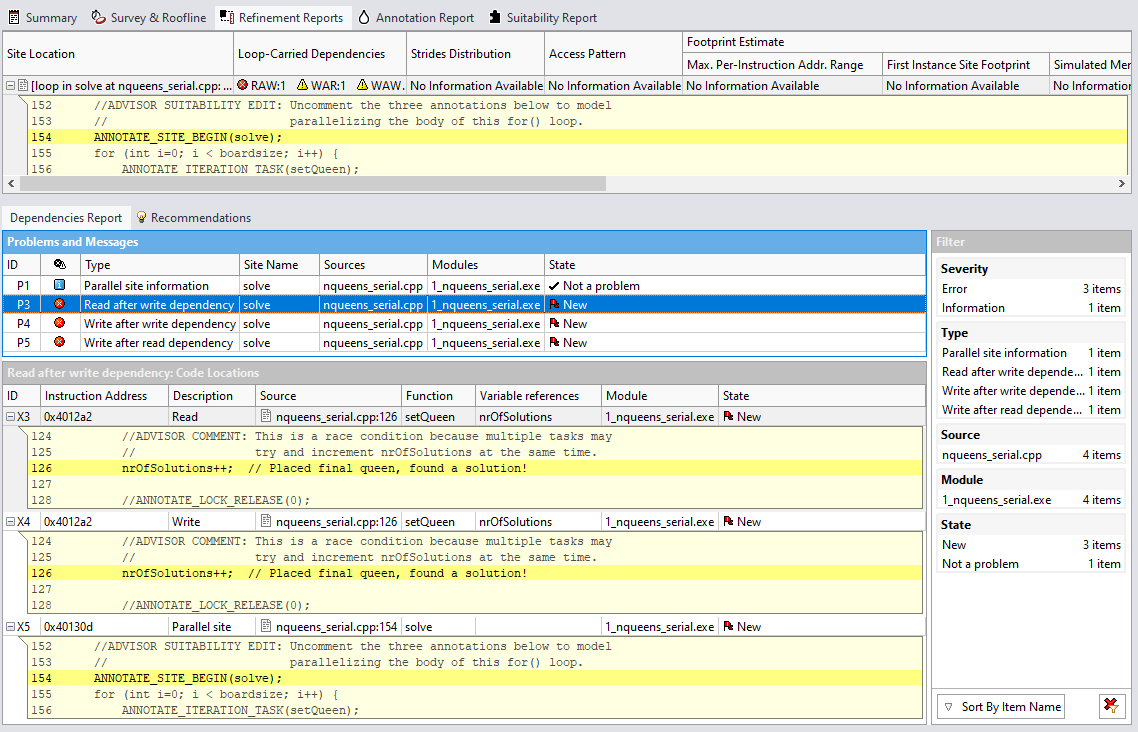
- Go to the Refinement reports tab to see if the annotated loops have dependencies that prevent parallelism.

- In the top pane of the Refinement Report, notice RAW (read after write), WAR (write after read), and WAW (write after write) dependencies in the loop in solve at nqueens_serial.cpp:154. T
- From the top pane, select the loop in solve at nqueens_serial.cpp:154.
- In the Problems and Messages pane, examine the dependency problems found in the loop in more details. Select one of the problems to see more information. For example, select the Read after write dependency.
- In the Code Locations pane, examine the source of the Read after write dependency: The instructions reference the nrOfSolutions variable as the Variable Reference column shows. This means that a race condition happens because multiple tasks may try to increment the same variable at the same time.
You should fix the dependencies before applying threading to the application.
Next Steps
- Fix the dependencies found in the annotated loops. From the sample application source code, search for ADVISOR CORRECTNESS EDIT and follow the directions in the sample code to fix the problems (make six total edits).
- Rebuild the application and rerun the Threading perspective with the Medium accuracy (run the Survey, Trip Counts, Suitability, and Dependencies analyses).
- Make sure there are no dependencies found and your fixes did not negatively impact the predicted maximum speedup. Notice that the predicted speedup is higher and the load imbalance is green and does not impact the estimated performance anymore for the CPU count up to 8.
- When you decide the predicted maximum speedup benefit is worth the effort to add parallelism to your target, replace annotations with parallel framework code.
This sample application already has the versions with replaced annotations with parallel framework code. Examine the following files:
Parallel Framework
File
Intel® Cilk™ Plus
3_nqueens_cilk.cpp
OpenMP*
3_nqueens_omp.cpp
Intel® Threading Building Blocks (Intel® TBB)
3_nqueens_tbb.cpp
- Build the parallel version of the sample.
- Test the resulting parallel application for correctness and verify its actual parallel performance using other Intel Advisor perspectives, the Intel® Inspector, and Intel® VTune™ Profiler.