In this module, you will learn:
- Steps to add Instrumentation and Tracing Technology API (ITT API) in an application.
- Steps to set up environment variables to use data collection and processing functions.
- Using a sample script to analyze collected measurement data.
Overview
The sample application uses the Instrumentation and Tracing Technology API (ITT API) from the Intel® Time Coordinated Computing Tools (Intel® TCC Tools). The ITT APIs generate and control the collection of trace data during application run.
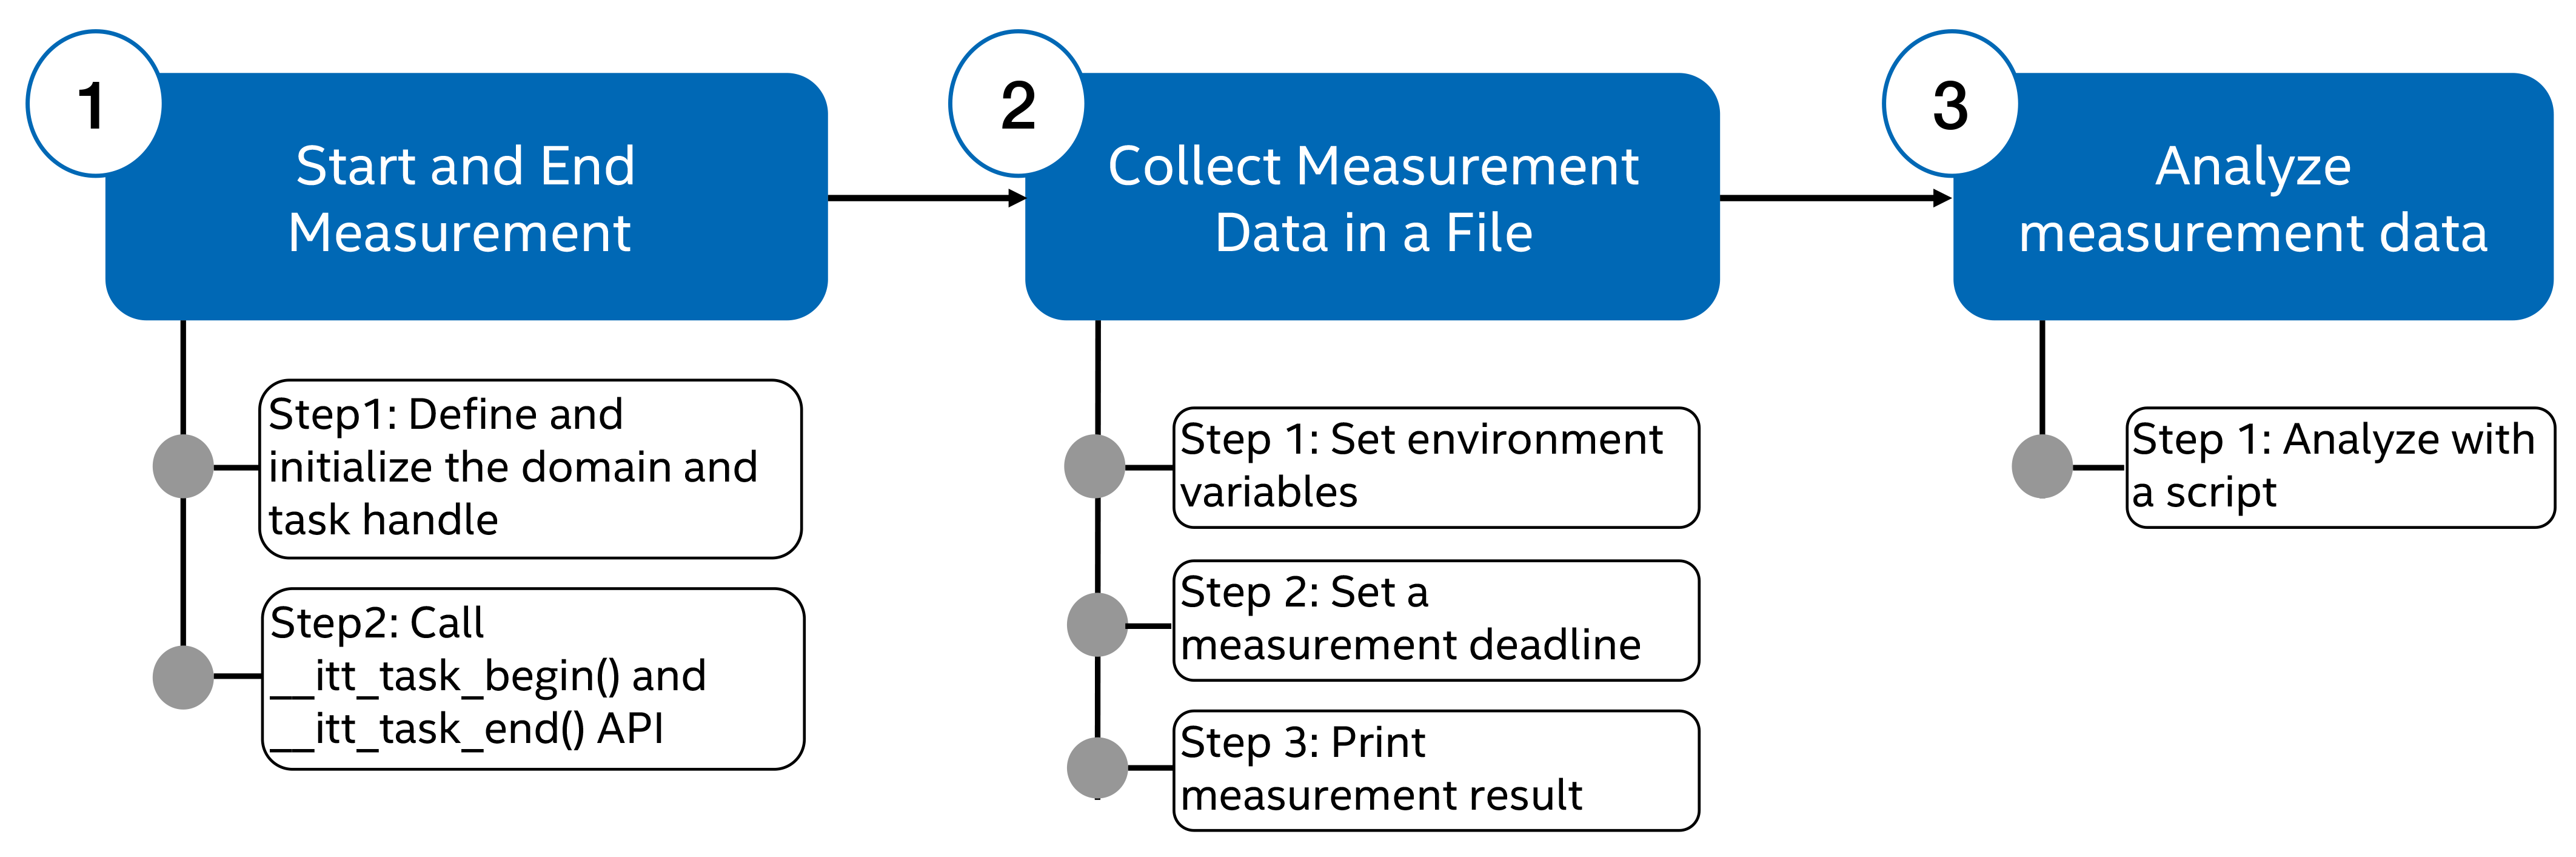
There are three parts of implementing measurement library in this sample:
- Start and end the measurement
- Collect measurement data and store it into a text file
- Analyze measurement data
Following are the lists of environment variables and API functions that are used in the sample application:
Table 1. List of environment variables used in the sample application
| Environment Variable | Description |
|---|---|
| INTEL_LIBITTNOTIFY64 | Specify the collector library. |
| TCC_USE_SHARED_MEMORY | Use a shared memory ring buffer instead of a local buffer to store all measurement results. Can be true or false. Default: false. |
| TCC_MEASUREMENTS_BUFFERS | Define the buffers that will hold the measurements generated from your application. |
| TCC_MEASUREMENTS_DUMP_FILE | File where measurements are logged after the program finishes. |
| TCC_MEASUREMENTS_TIME_UNIT | Time unit that will be used to store the results. |
Table 2. API functions used in the sample application
| API Function | Description |
|---|---|
| _itt_task_begin | Start the measurement. |
| _itt_task_end | End the measurement. |
| __itt_domain_create() | Initialize the domain. |
| __itt_string_handle_create() | Initialize the task handle. |
| tcc_measurement_set_deadline() | Set the deadline value. |
| notify_deadline() | Example callback function that prints a message when a deadline violation occurs. |
| tcc_measurement_print() | Output certain statistics to the console from data structures created in the measurement library collector. |
| tcc_measurement_convert_clock_to_timespec() | Convert CPU clock cycles to the standard Linux struct timespec. |
| tcc_measurement_convert_time_units_to_clock() | Convert a time unit to CPU clock cycles. |
| tcc_measurement_get() | Get the pointer to the measurement structure. |
Start and End Measurement
The ITT API uses the function _itt_task_begin to collect the start time of a task and _itt_task_end to collect the end time of a task using the CPU’s timestamp counter (TSC). It then calculates the difference between the start and end timestamps to get the latency of the task.
The following steps show how to implement the measurement library to collect jitter and cycle time measurements for each iteration.
Step 1: Define and initialize the domain and task handle
The sample application code defines and initializes the following parameters which are used by the _itt_task_begin and _itt_task_end API:
- domain_name: This is a string identifier of the domain. A domain enables tagging trace data for different modules or libraries in a program. You can selectively enable or disable specific domains in your application, to filter the subsets of instrumentation that are collected. The overhead of a disabled domain is a single if check.
- measurement_name: This is a string identifier of the measurement instance. This name will be used to identify this measurement instance for buffer configuration and analysis.
The following code shows the example of initializing domain_name and measurement_name parameters.
Reference code: robotic-arm-tcc.cpp file line 64 to 68.
// Initialize the ITT task handle to collect performance data for the sample workload
 string draw_measurement_name = "Drawing";
 string domain_name = "TCC";
 __itt_domain *domain;
 __itt_string_handle *drawing_handler;
Reference code: robotic-arm-tcc.cpp file line 107 to 109.
// Initialize the ITT task handle to collect performance data for the sample workload
     domain = __itt_domain_create(domain_name.c_str());
     drawing_handler = __itt_string_handle_create(draw_measurement_name.c_str());
Step 2: Call __itt_task_begin() and __itt_task_end API
To measure the cycle time for each iteration of CPU core reading gcode command and sending the command to the robotic arm, add the __itt_task_begin API to the beginning of the laser engraving task and add the __itt_task_end API to the end of the laser engraving task.
Following is the example of __itt_task_begin and __itt_task_end APIs added to the sample application code.
Reference code: robotic-arm-tcc.cpp file line 261 to 298.
if (iter >= 10) // For the 10th iteration onwards, set up the measurement cycle for recording the jitter of the workload
        {
            // Start TCC measurement loop for cyclic loop
            __itt_task_begin(domain, __itt_null, __itt_null, drawing_handler);
        }

        // Loads a command from the list of gcode commands
        command_buffer = gcodeArray[iter];
        string append_speed = " " + speed;

        if (record) // Recording using Chrono library is enabled. On top of measurements from TCC measurement library, Chrono library is used to record the timing measurements into a CSV file as well
        {
            // Measure wake_up_time and the time lag in waking up the thread
            auto start = chrono::high_resolution_clock::now();
            auto wake_time_diff = start - prev_wake_time;
            long long wake_time_ms = std::chrono::duration_cast<std::chrono::nanoseconds>(wake_time_diff).count();
            printf("Iteration: %d, actual period: %d\n", iter, wake_time_ms);
            prev_wake_time = start;

            // Send synchronous command to the arm; Will block the thread until the action is completed
            ret = swiftPtr->send_cmd_sync((command_buffer + append_speed).c_str());

            auto elapsed = chrono::high_resolution_clock::now() - start;
            long long elapsed_ms = std::chrono::duration_cast<std::chrono::milliseconds>(elapsed).count();

            // Writes the time to send a command to the robotic arm and the wake up time for the iteration into the csv file
            csvFile << iter << "," << elapsed_ms << "," << wake_time_ms << "," << gcodeArray[iter] << endl;
        }
else // Only record timing measurement using TCC Measurement Library
        {
            // Send synchronous command to the arm; Will block the thread until the action is completed
            ret = swiftPtr->send_cmd_sync((command_buffer + append_speed).c_str());
        }

        // Sleep for the remaining period (Only sleep after the 10th iteration where the periodic workload is initialized)
        if (iter >= 10)
        {
            // Suspend thread for remaining period and once woken up, record the loop period
            wait_rest_of_period(&pinfo);
            __itt_task_end(domain);
        }
Collect Measurement Data and Storing in Text File
To collect and store data measurement, use a shared library called a collector to perform data collection and processing. The collector is selected and loaded at runtime based on the value of the INTEL_LIBITTNOTIFY64 environment variable. The measurement library uses environment variables for data collection control to allow flexible configuration of each application separately. There are multiple environment variables you can use for data collection. This sample application uses the following environment variables:
- TCC_USE_SHARED_MEMORY – uses a shared memory ring buffer to enable streaming all measurement results to a separate application.
- TCC_MEASUREMENTS_BUFFERS – defines the buffer structure that holds the measurement data, such as buffer name, size and maximum tolerable latency. This sample application sets this variable to Drawing:3000 where Drawing is the buffer name and 3000 is the buffer size.
- TCC_MEASUREMENTS_DUMP_FILE – a text file that logs the measurement data once the application is completed.
- TCC_MEASUREMENTS_TIME_UNIT – defines the time unit used to store the measurement data. Options are CPU clock cycles (clk), nanoseconds (ns), and microseconds (us). This sample application sets this variable to microseconds(us).
Step 1: Declare and Set Environment Variables
The following code shows the environment variables declaration in the sample application.
Reference code: robotic-arm-tcc.cpp file line 48 to line 62.
/* ==================== TCC Measurement Library settings ==================== */
// Environment variables to be set
string collector_library_var_name = "INTEL_LIBITTNOTIFY64";
string tcc_collector_name = "libtcc_collector.so";
string memory_var_name = "TCC_USE_SHARED_MEMORY";
string use_shared_memory = "true";
string tcc_time_unit_name = "TCC_MEASUREMENTS_TIME_UNIT";
string tcc_measurement_time_unit = "us";
string tcc_dumpfile_name = "TCC_MEASUREMENTS_DUMP_FILE";
string tcc_dumpfile = "tcc_dump.txt";
string tcc_buffer_name = "TCC_MEASUREMENTS_BUFFERS";
string tcc_buffer = "Drawing:3000";

// Measurement and domain name used to record the timing measurements obtained from Measurement library
TCC_TIME_UNIT draw_time_unit = TCC_TU_US; // Time unit to record the timing measurements in
The following code shows the example of setting the environment variables.
Reference code: robotic-arm-tcc.cpp file line 97 to line 105.
int tcc_status;
    /* Set up ittnotify environment variable to allow latency measurement */
    setenv(collector_library_var_name.c_str(), tcc_collector_name.c_str(), 0);

    /* Set up data collection using TCC buffer */
    setenv(memory_var_name.c_str(), use_shared_memory.c_str(), 0);
    setenv(tcc_time_unit_name.c_str(), tcc_measurement_time_unit.c_str(), 0);
    setenv(tcc_dumpfile_name.c_str(), tcc_dumpfile.c_str(), 0);
    setenv(tcc_buffer_name.c_str(), tcc_buffer.c_str(), 0);
Step 2: Set a Measurement Deadline
- Create a function that the application will call every time an iteration exceeds the deadline. The following code shows the example of deadline monitoring function used in the sample application. The function prints out the latency of an iteration that exceeds deadline in CPU clock cycles, nanoseconds, and microseconds.
Reference code: robotic-arm-tcc.cpp file line 83 to line 90./* Callback function for the deadline monitoring. Called when iteration latency exceeds the deadline. */ void notify_deadline(__attribute__((unused)) struct tcc_measurement *measurement, uint64_t cycles) { long int nsec = tcc_measurement_convert_clock_to_timespec(cycles).tv_nsec; int usec = nsec / 1000; printf("Latency exceeding deadline: %lu CPU cycles (%ld nsec) (%ld usec)\n", cycles, nsec, usec); deadline_counter++; } - Set the pointer to the measurement structure. The following code shows the example of getting the draw_measurement_ptr pointer to the tcc_measurement measurement structure.
Reference code: robotic-arm-tcc.cpp file line 71.struct tcc_measurement *draw_measurement_ptr = NULL; -
Verify that the function to get the pointer to measurement structure, tcc_measurement_get, is successful.
Reference code: robotic-arm-tcc.cpp file line 118 to line 123./* Retrieves the measurement structure by ITT domain and task name. */ if ((tcc_status = tcc_measurement_get(domain, drawing_handler, &draw_measurement_ptr)) != TCC_E_SUCCESS) { cout << "Unable to get access to measurement structure for draw" << endl; return -TCC_E_NOT_AVAILABLE; } - Set the deadline value using tcc_measurement_set_deadline function. The sample application sets the deadline value of 500 ms with a jitter margin of 20 µs. The code uses tcc_measurement_convert_time_units_to_clock library to convert the measurement time from microsecond to CPU clock cycles. Reference code: robotic-arm-tcc.cpp file line 125 to line 132.
/* Sets a deadline value and callback for the draw measurement structure. */
    unsigned deadline_in_clocks =
        tcc_measurement_convert_time_units_to_clock(period_ms * 1000 + 20, TCC_TU_US);
    if ((tcc_status = tcc_measurement_set_deadline(draw_measurement_ptr, deadline_in_clocks, notify_deadline)) !=
        TCC_E_SUCCESS)
    {
        cout << "Unable to set up deadline" << endl;
    }
Step 3: Print Measurement Result
The sample application uses a combination of printf object in C++ and the tcc_measurement_print() API to print out the number of sent commands, the number of iterations that exceed the deadline, the total number of iterations ran, and the cycle time statistics in microseconds.
Reference code: robotic-arm-tcc.cpp file line 301 to line 305.
// Prints out statistics of the workload
    cout << "=============== End of workload ===============" << endl;
    printf("Number of commands sent: %d\n", iter);
    printf("Number of iterations exceeding deadlines: %d\n", deadline_counter);
    tcc_measurement_print(draw_measurement_ptr, draw_time_unit);
Analyze Measurement Data with Own Application
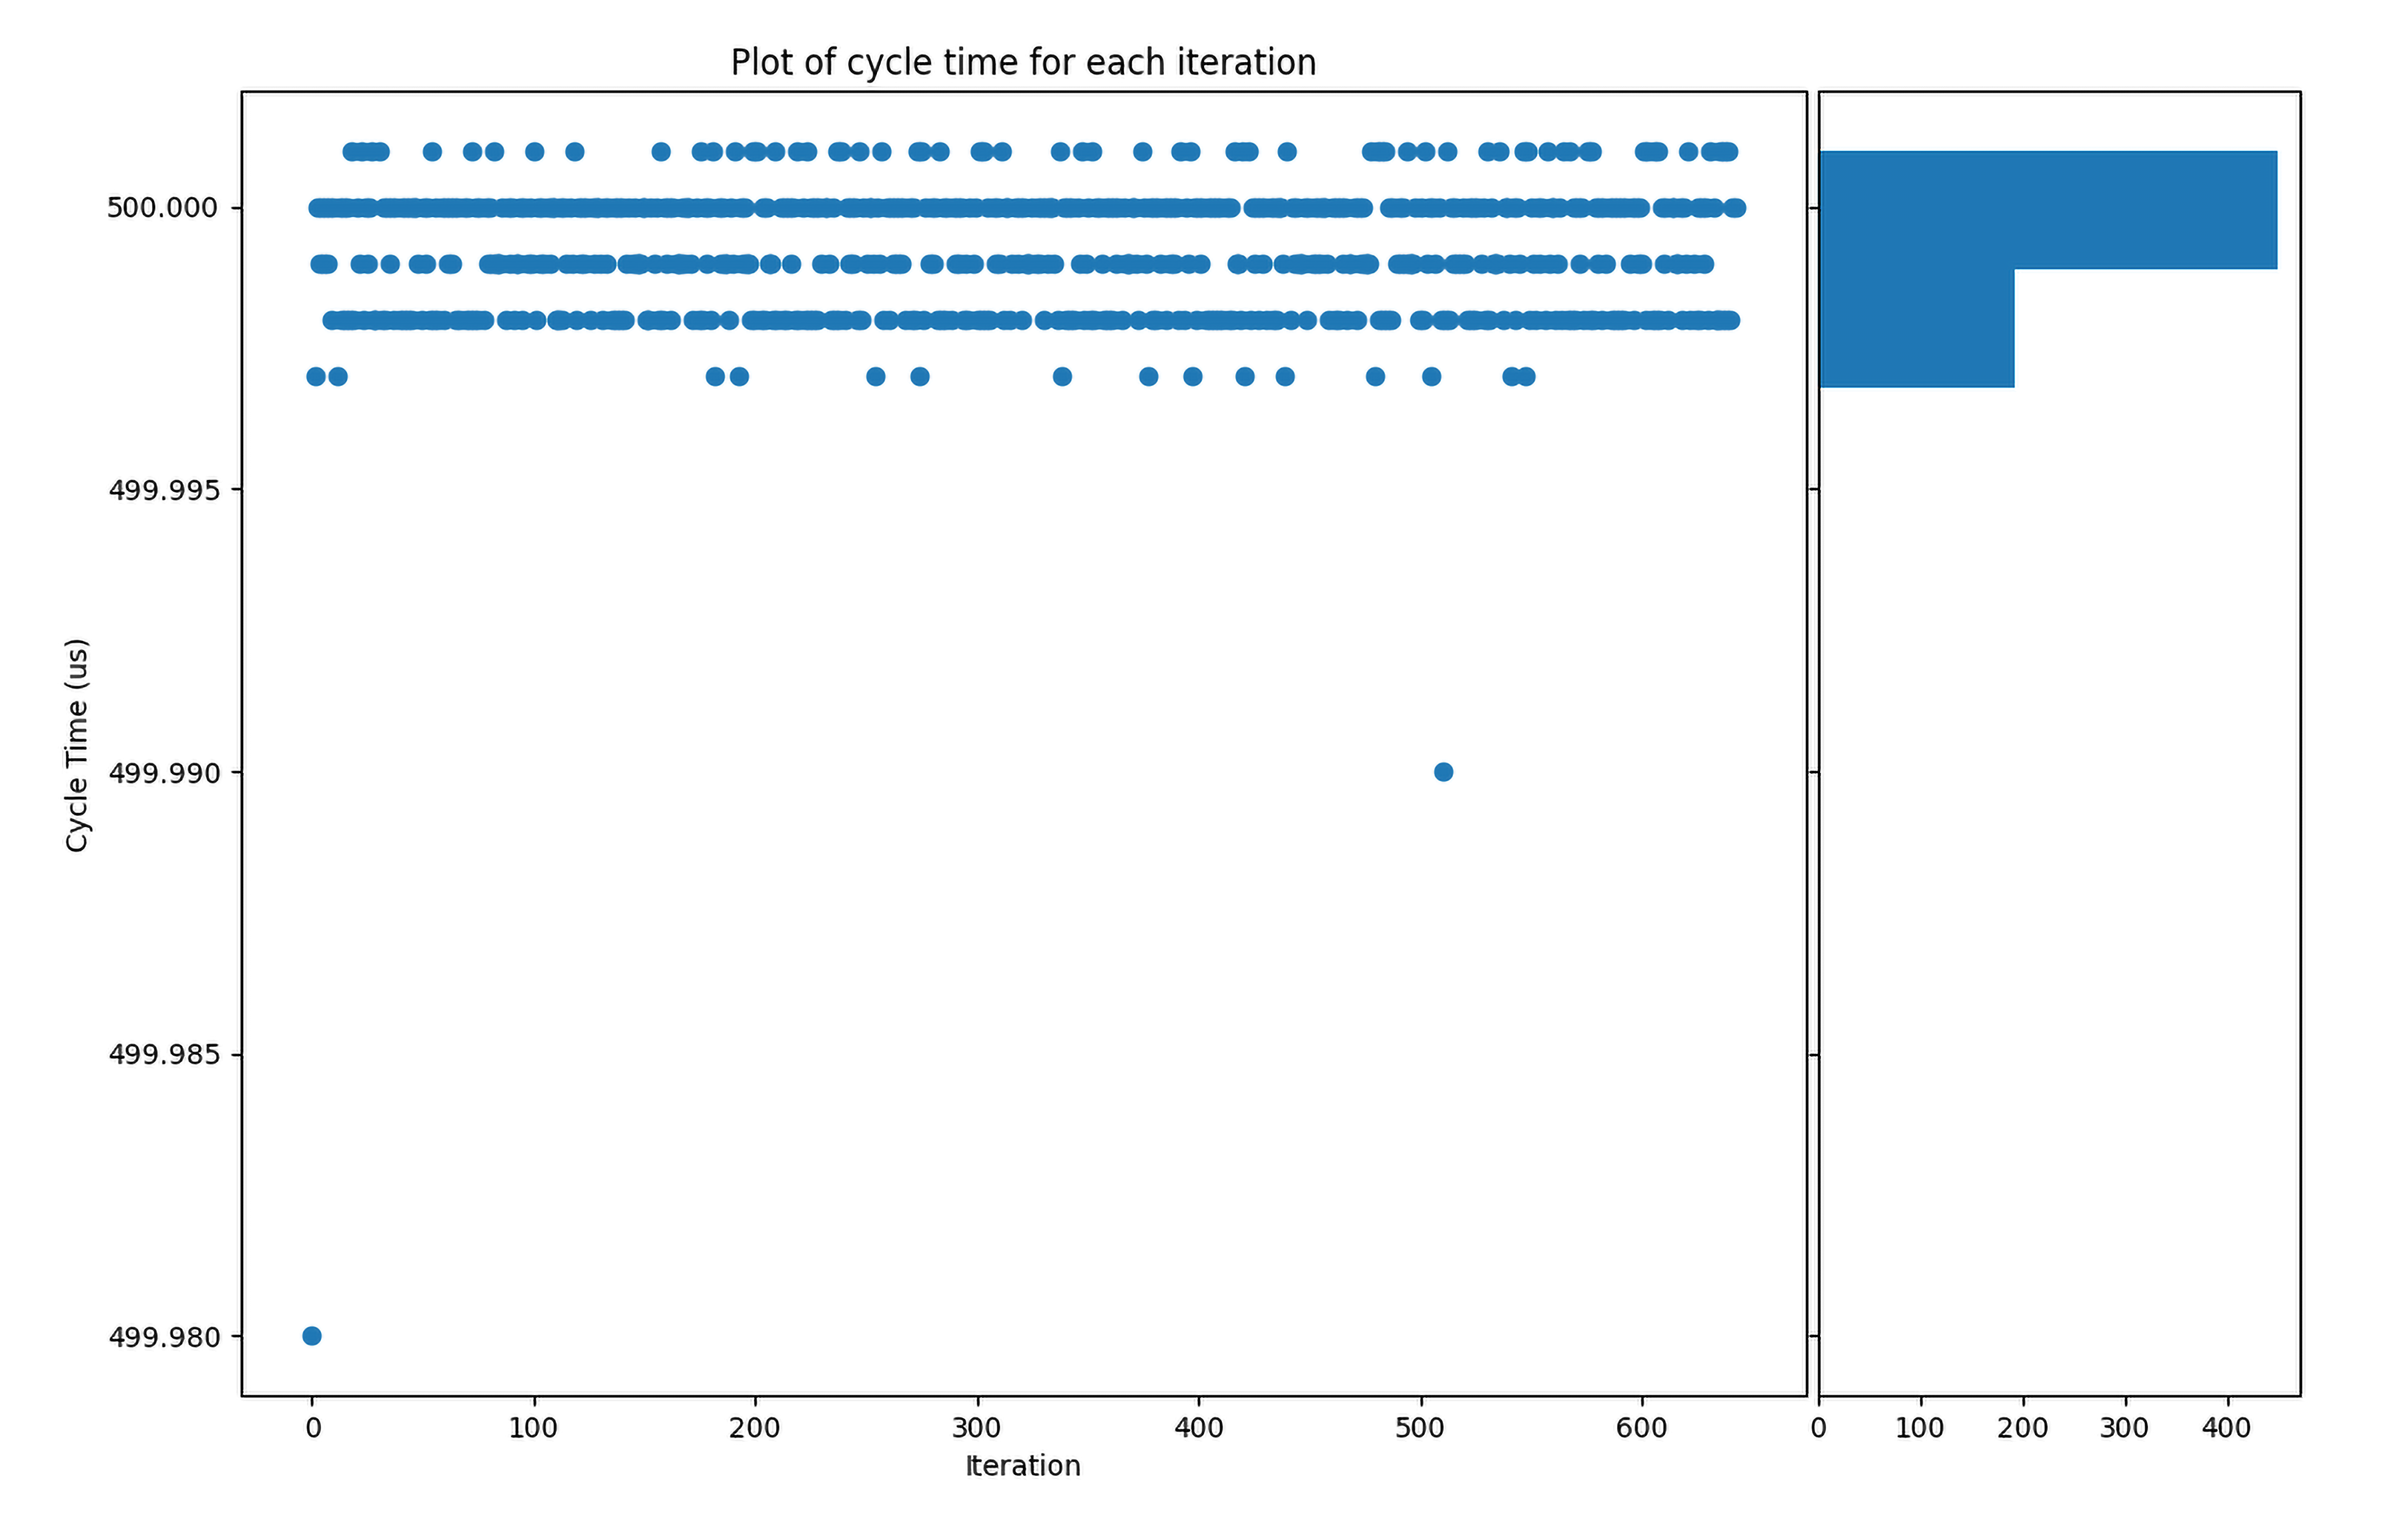
You can use your own application to analyze the data measurement collected from the measurement library. In this sample application, we are using a Python* script (filename timing_analysis.py) to plot graphs based on cycle time for each iteration.
The Python* script is called after the application and measurement result collection are completed. The graph is stored in timing/plots directory with the name tcc_cycle_time_per_iter.png. Use the following command to copy the .png file to the host system to view the graph.
scp root@<target_system_ip>:/<application.industrial.realtime.demo.robotic-arm-engraving_directory>/timing/plots/tcc_cycle_time_per_iter.png <destination_folder_in_your_host_system>
Following is an example showing cycle time per iteration for the laser engraving workload on 11th Gen Intel® Core™ processors with Intel® Board Support Package and Intel® TCC Mode: