Introduction
Yardstick Network Services Benchmarking (NSB) is a test framework for measuring the performance of a virtual network function (VNF) in a network function virtualization (NFV) environment. Yardstick NSB may also be used to characterize the performance of an NFV infrastructure (NFVI).
Yardstick NSB may be run in three environments: native Linux* (bare metal), standalone virtualized (VNF running in a virtual machine), and managed virtualization. This tutorial is the first of a two-part series. It details how to install Yardstick NSB on bare metal. Part two shows how to run Yardstick NSB for characterizing an NFV/NFVI.
Installing Yardstick NSB on Bare Metal
In this section, we show how to install Yardstick NSB on bare metal for creating a minimal-scale test system capable of running the NFVI test cases and visualizing the output.
The hardware and software requirements used in these tests include:
- A jump server to run Yardstick NSB software.
- Two other servers connected to each other, back-to-back, with two network interfaces on each server. One server is used as a system under test (SuT); the other is used as a traffic generator (TG).
- A managed network that connects the three servers.
- A minimum of 20 gigabytes (GB) of available hard disk space on each server.
- A minimum 8 GB of memory on each server.
- A minimum of eight cores needed on the SuT and TG.
- On the SuT and TG, one 1-Gigabit Ethernet (GbE) network interface is necessary for the managed network and two 10-GbE interfaces for the data plane. The jump server only requires one 1-GbE network interface for the managed network. The network interfaces for the data plane must support the Data Plane Development Kit (DPDK).
- All three servers have Ubuntu* 16.04 installed.
The following figure illustrates the configuration of the servers:
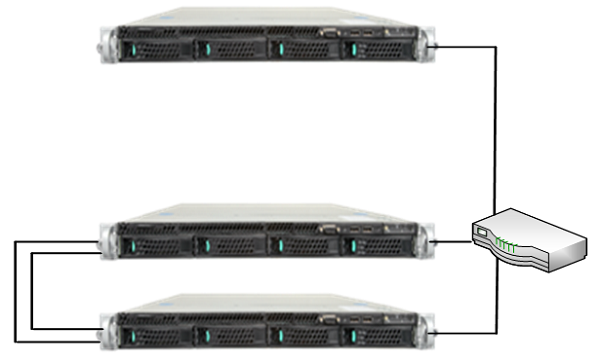
Figure 1. Network configuration of the servers. All three servers connect using a managed network. On the SuT and the TG, two network interfaces are connected back-to-back to serve as a data plane network. The network interfaces in the data plane network support DPDK.
Prerequisites on the jump server, the SuT, and the TG
The following requirements are applicable for the jump server, the SuT, and the TG:
Network connectivity
- All servers should have an Internet connection so they can download and install NSB software.
- Each server should be able to log in to the others using a Secure Shell (SSH) with root privilege via the management network.
- For convenience, it is recommended that you configure a static IP address on each server so that in case you have to reboot the machines, their IP addresses in the configuration files remain unchanged.
- On each server, one should be able to employ HTTP and HTTPS to transfer data between a browser and a website. If you are behind a firewall, you may need to set the HTTP/HTTPS proxy:
$ export http_proxy=http://<myproxy.com>:<myproxyport>
$ export https_proxy=http://<mysecureproxy.com>:<myproxyport>
Check package resources (optional)
Add repositories at the end of the /etc/apt/sources.list file:
$ sudo vi /etc/apt/sources.list
deb http://archive.ubuntu.com/ubuntu xenial main restricted universe multiverse
Depending on your configuration, you may have to add the following two lines to the file /etc/apt/apt.conf.d/95proxies:
$ cat /etc/apt/apt.conf.d/95proxies
Acquire::http::proxy "http://<myproxy.com>:<myproxyport>/";
Acquire::https::proxy "https://<mysecureproxy.com>:<myproxyport>/";
Then, reboot the system. After logging on, update the package lists for packages that need upgrading:
$ sudo apt-get update
Ign:1 http://ubuntu-cloud.archive.canonical.com/ubuntu xenial-updates/ocata InRelease
Hit:2 http://ppa.launchpad.net/juju/stable/ubuntu xenial InRelease
Ign:3 http://ubuntu-cloud.archive.canonical.com/ubuntu xenial-updates/pike InRelease
Hit:4 http://ubuntu-cloud.archive.canonical.com/ubuntu xenial-updates/ocata Release
Hit:6 http://ubuntu-cloud.archive.canonical.com/ubuntu xenial-updates/pike Release
Get:8 http://us.archive.ubuntu.com/ubuntu xenial InRelease [247 kB]
Hit:9 http://us.archive.ubuntu.com/ubuntu xenial-updates InRelease
Hit:10 http://us.archive.ubuntu.com/ubuntu xenial-backports InRelease
Get:11 http://archive.ubuntu.com/ubuntu xenial InRelease [247 kB]
Hit:12 http://ppa.launchpad.net/maas/stable/ubuntu xenial InRelease
Hit:13 http://security.ubuntu.com/ubuntu xenial-security InRelease
Fetched 494 kB in 41s (11.9 kB/s)
Reading package lists... Done
Add additional packages (optional)
If needed, additional packages (openssh-server, xfce4, xfce4-goodies, tightvncserver, tig, apt-transport-https, ca-certificates) may be installed:
$ sudo apt-get update && sudo apt-get install openssh-server \
xfce4 xfce4-goodies tightvncserver tig apt-transport-https ca-certificates
SSH root login
To allow root login in using ssh, add "PermitRootLogin yes" to the /etc/ssh/sshd_config file, and then restart the ssh service:
$ sudo vi /etc/ssh/sshd_config
PermitRootLogin yes
$ sudo service ssh restart
Add user with a password using sudo
To use sudo to give the user permission with a password, edit /etc/sudoers and add myusername ALL=(ALL) NOPASSWD:ALL to the end, where myusername is the user name of the account. It is better to use visudo to edit the /etc/sudoers file instead of vi, since visudo can validate the syntax of the file upon saving.
$ sudo visudoThen, add this line at the end of the /etc/sudoers file:
ausername ALL=(ALL) NOPASSWD:ALL
If you are behind a firewall, you have to add this line after the "Defaults env_reset" line:
Defaults env_keep = "http_proxy https_proxy"
Install yardstick NSB on the jump server, the SuT, and the TG
Install yardstick NSB software
To install Yardstick NSB software, the following instructions are executed on the jump server, the SuT, and the traffic generator. In this tutorial, to install the stable Euphrates* version of Yardstick, run the following commands:
$ git clone https://gerrit.opnfv.org/gerrit/yardstick
$ cd yardstick
$ git checkout stable/euphrates
$ sudo ./nsb_setup.sh
It can take up to 15 minutes to complete the installation. The script not only installs Yardstick NSB, but it also installs the DPDK, the realistic traffic generator (TRex*), and downloads packages required for building the Docker* image of Yardstick. Although only the jump sever needs to have Yardstick NSB installed, for simplicity just run the script on the three servers (the jump server, the SuT, and the TG). At the end, you just delete the Docker image of Yardstick on the SuT and the TG servers.
Verify yardstick NSB installation on the jump server
After successfully installing on the jump server, you may want to verify that the Yardstick image is created. In the jump server, list all of the Docker image(s):
$ sudo docker images
REPOSITORY          TAG             IMAGE ID            CREATED            SIZE
opnfv/yardstick     stable          4a035a71c93f        6 days ago         2.08 GB
You can check the state of the running container(s):
$ sudo docker ps
CONTAINER ID        IMAGE                    COMMAND                  CREATED             STATUS              PORTS                NAMES
5c9627810060        opnfv/yardstick:stable   "/usr/bin/supervisord"   25 minutes ago      Up 25 minutes       5000/tcp, 5672/tcp   yardstick
This shows that a Docker container named "yardstick" is currently running on the jump server. To connect to the Yardstick NSB running container from the jump server:
$ sudo docker exec -it yardstick /bin/bash
root@5c9627810060:/home/opnfv/repos#
root@5c9627810060:/home/opnfv/repos# pwd
/home/opnfv/repos
root@5c9627810060:/home/opnfv/repos# ls
storperf  yardstick
To check the IP address of the Yardstick NSB container from its container:
root@5c9627810060:/home/opnfv/repos# ip a
1: lo: <LOOPBACK,UP,LOWER_UP> mtu 65536 qdisc noqueue state UNKNOWN group default qlen 1
    link/loopback 00:00:00:00:00:00 brd 00:00:00:00:00:00
    inet 127.0.0.1/8 scope host lo
       valid_lft forever preferred_lft forever
    inet6 ::1/128 scope host
       valid_lft forever preferred_lft forever
21: eth0@if22: <BROADCAST,MULTICAST,UP,LOWER_UP> mtu 1500 qdisc noqueue state UP group default
    link/ether 02:42:ac:11:00:08 brd ff:ff:ff:ff:ff:ff link-netnsid 0
    inet 172.17.0.8/16 scope global eth0
       valid_lft forever preferred_lft forever
    inet6 fe80::42:acff:fe11:8/64 scope link
       valid_lft forever preferred_lft forever
Note that the IP address of the Yardstick NSB container is 172.17.0.8.
By default, the results when running Yardstick NSB are displayed on screen in text. To improve the visualization of the results, you need to install InfluxDB* and the Grafana* dashboard.
Installing InfluxDB* on the Jump Server
From the Yardstick NSB container, run the following command to start the Influx container:
root@5c9627810060# yardstick env influxdb
No handlers could be found for logger "yardstick.common.utils"
/usr/local/lib/python2.7/dist-packages/flask/exthook.py:71: ExtDeprecationWarning: Importing flask.ext.restful is deprecated, use flask_restful instead.
  .format(x=modname), ExtDeprecationWarning
* creating influxDB
After it starts, you need to find the name of the Influx container. List all running containers from another jump server terminal:
$ sudo docker ps
CONTAINER ID        IMAGE                    COMMAND                  CREATED             STATUS              PORTS                                            NAMES
dad03fb24deb        tutum/influxdb:0.13      "/run.sh"                15 seconds ago      Up 14 seconds       0.0.0.0:8083->8083/tcp, 0.0.0.0:8086->8086/tcp   modest_bassi
5c9627810060        opnfv/yardstick:stable   "/usr/bin/supervisord"   31 minutes ago      Up 31 minutes       5000/tcp, 5672/tcp
Note: A name was generated for the Influx container: "modest_bassi". From a terminal on the jump server, run the following Docker command to connect to the Influx container by passing its name as a parameter:
$ sudo docker exec -it modest_bassi /bin/bash
root@dad03fb24deb:/#
root@ dad03fb24deb:/# pwd
/
root@ dad03fb24deb:/# ls
bin   config  dev  home  lib64  mnt  proc  run     sbin  sys  usr
boot  data    etc  lib   media  opt  root  run.sh  srv   tmp  var
After connecting to the Influx container, find its IP address by running the following command from the Influx container:
root@dad03fb24deb:/# ip a
1: lo: <LOOPBACK,UP,LOWER_UP> mtu 65536 qdisc noqueue state UNKNOWN group default qlen 1
    link/loopback 00:00:00:00:00:00 brd 00:00:00:00:00:00
    inet 127.0.0.1/8 scope host lo
       valid_lft forever preferred_lft forever
    inet6 ::1/128 scope host
       valid_lft forever preferred_lft forever
44: eth0@if45: <BROADCAST,MULTICAST,UP,LOWER_UP> mtu 1500 qdisc noqueue state UP group default
    link/ether 02:42:ac:11:00:02 brd ff:ff:ff:ff:ff:ff
    inet 172.17.0.2/16 scope global eth0
       valid_lft forever preferred_lft forever
    inet6 fe80::42:acff:fe11:2/64 scope link
       valid_lft forever preferred_lft forever
It shows that 172.17.0.2 is the IP address of the Influx container. This IP address is used in the yardstick config file. From the Yardstick NSB container, edit the yardstick config file at /etc/yardstick/yardstick.conf, and make sure the Influx IP address is set to 172.17.0.2.
root@5c9627810060:/home/opnfv/repos# cat /etc/yardstick/yardstick.conf
[DEFAULT]
debug = False
dispatcher = influxdb

[dispatcher_http]
timeout = 5
target = http://127.0.0.1:8000/results

[dispatcher_file]
file_path = /tmp/yardstick.out
max_bytes = 0
backup_count = 0

[dispatcher_influxdb]
timeout = 5
target = http://172.17.0.2:8086
db_name = yardstick
username = root
password = root

[nsb]
trex_path = /opt/nsb_bin/trex/scripts
bin_path = /opt/nsb_bin
trex_client_lib = /opt/nsb_bin/trex_client/stl
Note: There is a dispatch file located at /etc/yardstick.out in the Yardstick container.
To visualize the data, the graphical user interface (GUI) package should be installed on the jump server. Start a browser on the jump server and browse to http://<jumphost_IP>:8083. In this exercise, since the jump server’s IP address is 10.23.3.73, browse to http://10.23.3.73:8083 to access the InfluxDB web UI:
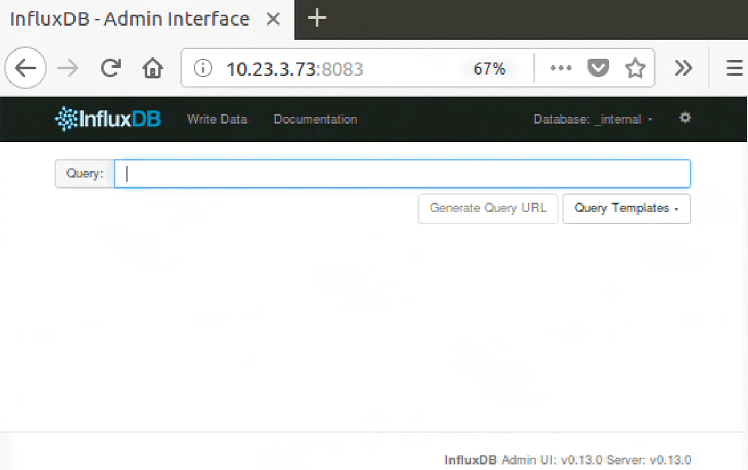
Figure 2. The InfluxDB* web UI.
In the Query box, type SHOW DATABASES. You should see "yardstick".
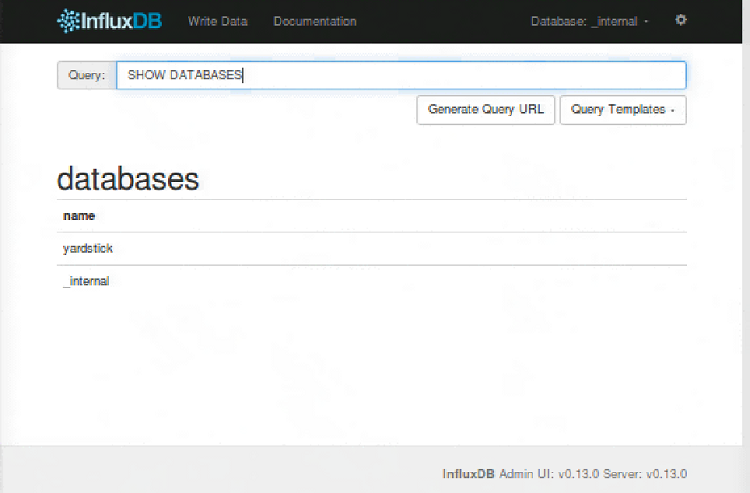
Figure 3. Show databases in InfluxDB*.
On the other hand, you can verify that the Influx database includes Yardstick NSB. From the Influx container, type influx and verify that the Yardstick database is available:
root@8aa048e69c34:/# influx
Visit https://enterprise.influxdata.com to register for updates, InfluxDB server management, and monitoring.
Connected to http://localhost:8086 version 0.13.0
InfluxDB shell version: 0.13.0
> SHOW DATABASES
name: databases
---------------
name
yardstick
_internal

> quit
root@8aa048e69c34:/#
Installing Grafana* on the Jump Server
Grafana is used to monitor and visualize data. From the Yardstick NSB container, run the following command to start the Grafana container:
root@5c9627810060:/home/opnfv/repos# yardstick env grafana
No handlers could be found for logger "yardstick.common.utils"
/usr/local/lib/python2.7/dist-packages/flask/exthook.py:71: ExtDeprecationWarning: Importing flask.ext.restful is deprecated, use flask_restful instead.
  .format(x=modname), ExtDeprecationWarning
* creating grafana                                                    [Finished]
Find the name of the Grafana running container, and list all running containers from another jump server terminal:
$ sudo docker images
REPOSITORY          TAG                 IMAGE ID            CREATED             SIZE
opnfv/yardstick     stable              4a035a71c93f        4 weeks ago         2.08 GB
grafana/grafana     4.4.3               49e2eb4da222        9 months ago        287 MB
tutum/influxdb      0.13                39fa42a093e0        22 months ago       290 MB

$ sudo docker ps
CONTAINER ID        IMAGE                    COMMAND                  CREATED             STATUS              PORTS                                            NAMES
077052dc73a9        grafana/grafana:4.4.3    "/run.sh"                38 minutes ago      Up 38 minutes       0.0.0.0:1948->3000/tcp                           confident_jones
dad03fb24deb        tutum/influxdb:0.13      "/run.sh"                57 minutes ago      Up 57 minutes       0.0.0.0:8083->8083/tcp, 0.0.0.0:8086->8086/tcp   modest_bassi
5c9627810060        opnfv/yardstick:stable   "/usr/bin/supervisord"   2 weeks ago         Up 17 hours         5000/tcp, 5672/tcp                               yardstick
Note: The name generated for the Grafana container is "confident_jones". From a terminal in the jump server, run the following Docker command to connect to the Influx container by passing its name as a parameter. Similar to the Influx container, you can query the IP address of the Grafana container:
$ sudo docker exec -it confident_jones /bin/bash
root@077052dc73a9:/# ls
bin  boot  dev  etc  home  lib  lib64  media  mnt  opt  proc  root  run  run.sh  sbin  srv  sys  tmp  usr  var
root@077052dc73a9:/# pwd
/

root@077052dc73a9:/# ip a
1: lo: <LOOPBACK,UP,LOWER_UP> mtu 65536 qdisc noqueue state UNKNOWN group default qlen 1
    link/loopback 00:00:00:00:00:00 brd 00:00:00:00:00:00
    inet 127.0.0.1/8 scope host lo
       valid_lft forever preferred_lft forever
    inet6 ::1/128 scope host
       valid_lft forever preferred_lft forever
48: eth0@if49: <BROADCAST,MULTICAST,UP,LOWER_UP> mtu 1500 qdisc noqueue state UP group default
    link/ether 02:42:ac:11:00:03 brd ff:ff:ff:ff:ff:ff
    inet 172.17.0.3/16 scope global eth0
       valid_lft forever preferred_lft forever
    inet6 fe80::42:acff:fe11:3/64 scope link
       valid_lft forever preferred_lft forever
It shows that 172.17.0.3 is the IP address of the Grafana container.
Configuration of the container is done by logging into the Grafana web UI. Start a new browser from the jump server and browse to http://<jumphost_IP>:1948. Since the jump host server IP address is 10.23.3.74, browse to http://10.23.3.74:1948. To log in, enter admin as user and admin as password. It brings you to the Grafana home dashboard.
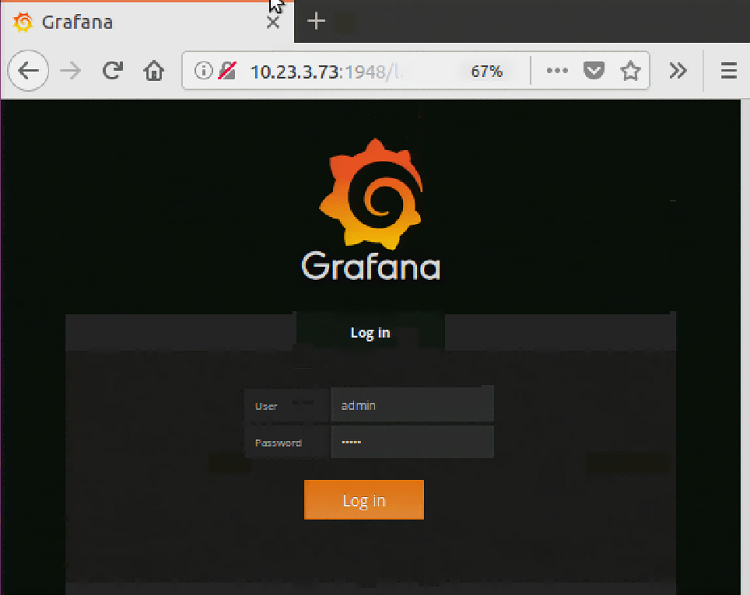
Figure 4. Enter admin as the user and admin as the password in the Grafana* web UI.
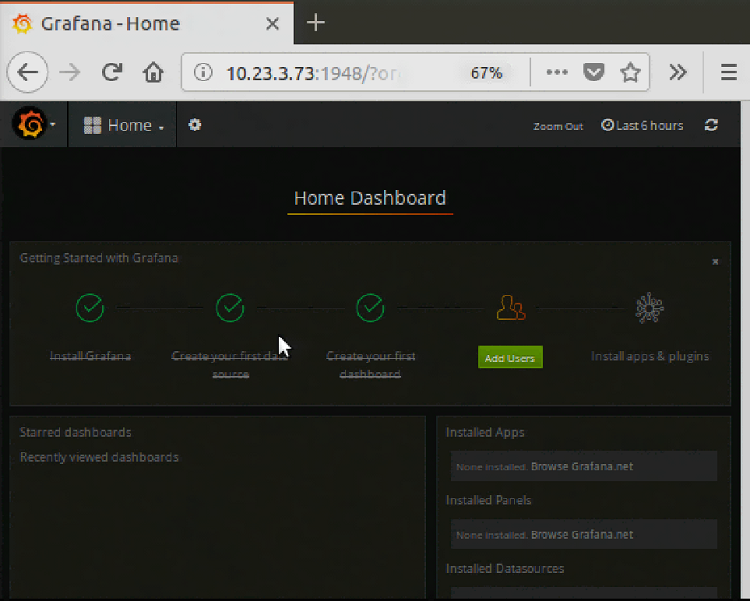
Figure 5. The Grafana* Home Dashboard.
Click Create your first data source and fill in the Add data source page with the following under the Config tag:
Name: yardstick
Type: scroll to InfluxDB
In Http settings:
URL: 172.17.0.3:8086 (refer to the IP address of Influx)
In Http Auth:
Click Basic Auth, then fill in (refer to user and password to login to Grafana)
In Basic Auth Details:
User: admin
Password: admin
In InfluxDB Details: (refer to the Yardstick database; see /etc/yardstick/yardstick.conf)
Database: yardstick
User: root
Password: root
Then click the Add button.
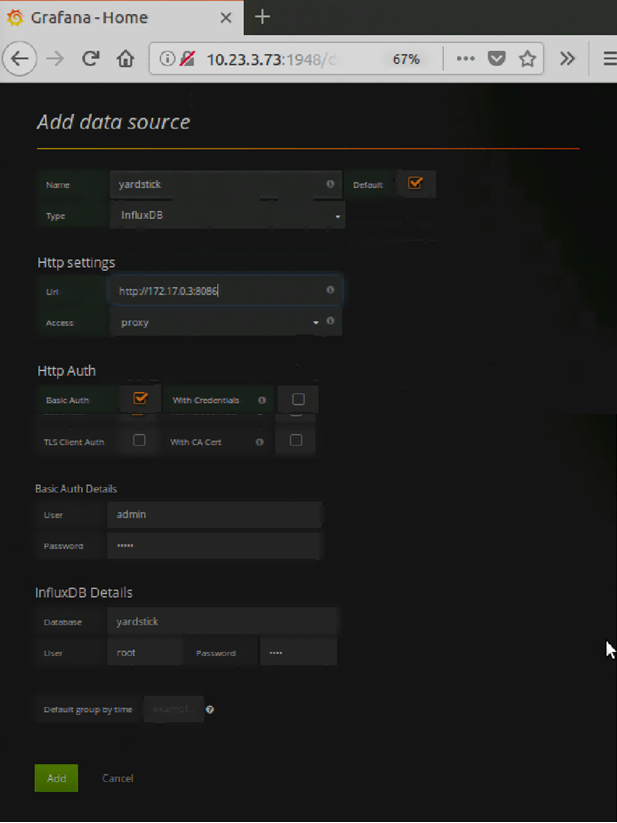
Figure 6. Fill-in on the Add data source page.
Note: After creating Influx and Grafana containers, Docker creates a bridge network automatically. This bridge connects the containers.
~$ ifconfig
docker0   Link encap:Ethernet  HWaddr 02:42:2a:85:81:8c
          inet addr:172.17.0.1  Bcast:0.0.0.0  Mask:255.255.0.0
          inet6 addr: fe80::42:2aff:fe85:818c/64 Scope:Link
          UP BROADCAST RUNNING MULTICAST  MTU:1500  Metric:1
          RX packets:179308 errors:0 dropped:0 overruns:0 frame:0
          TX packets:179321 errors:0 dropped:0 overruns:0 carrier:0
          collisions:0 txqueuelen:0
          RX bytes:13156392 (13.1 MB)  TX bytes:48160608 (48.1 MB)

enp3s0f0  Link encap:Ethernet  HWaddr a4:bf:01:00:92:73
          inet addr:10.23.3.155  Bcast:10.23.3.255  Mask:255.255.255.0
          inet6 addr: fe80::a6bf:1ff:fe00:9273/64 Scope:Link
          UP BROADCAST RUNNING MULTICAST  MTU:1500  Metric:1
          RX packets:246959 errors:0 dropped:0 overruns:0 frame:0
          TX packets:206311 errors:0 dropped:0 overruns:0 carrier:0
          collisions:0 txqueuelen:1000
          RX bytes:53823526 (53.8 MB)  TX bytes:32738472 (32.7 MB)

enp3s0f1  Link encap:Ethernet  HWaddr a4:bf:01:00:92:74
          UP BROADCAST RUNNING MULTICAST  MTU:1500  Metric:1
          RX packets:8776 errors:0 dropped:0 overruns:0 frame:0
          TX packets:2920 errors:0 dropped:0 overruns:0 carrier:0
          collisions:0 txqueuelen:1000
          RX bytes:1246733 (1.2 MB)  TX bytes:548262 (548.2 KB)

ens802    Link encap:Ethernet  HWaddr 68:05:ca:2e:76:e0
          UP BROADCAST MULTICAST  MTU:1500  Metric:1
          RX packets:0 errors:0 dropped:0 overruns:0 frame:0
          TX packets:0 errors:0 dropped:0 overruns:0 carrier:0
          collisions:0 txqueuelen:1000
          RX bytes:0 (0.0 B)  TX bytes:0 (0.0 B)

lo        Link encap:Local Loopback
          inet addr:127.0.0.1  Mask:255.0.0.0
          inet6 addr: ::1/128 Scope:Host
          UP LOOPBACK RUNNING  MTU:65536  Metric:1
          RX packets:510506 errors:0 dropped:0 overruns:0 frame:0
          TX packets:510506 errors:0 dropped:0 overruns:0 carrier:0
          collisions:0 txqueuelen:1
          RX bytes:210085327 (210.0 MB)  TX bytes:210085327 (210.0 MB)

veth2764a3d Link encap:Ethernet  HWaddr 7e:a4:8f:77:8c:c3
          inet6 addr: fe80::7ca4:8fff:fe77:8cc3/64 Scope:Link
          UP BROADCAST RUNNING MULTICAST  MTU:1500  Metric:1
          RX packets:2076 errors:0 dropped:0 overruns:0 frame:0
          TX packets:3745 errors:0 dropped:0 overruns:0 carrier:0
          collisions:0 txqueuelen:0
          RX bytes:193053 (193.0 KB)  TX bytes:8041958 (8.0 MB)

veth2fbd63e Link encap:Ethernet  HWaddr 7e:a6:d0:a0:66:d2
          inet6 addr: fe80::7ca6:d0ff:fea0:66d2/64 Scope:Link
          UP BROADCAST RUNNING MULTICAST  MTU:1500  Metric:1
          RX packets:179 errors:0 dropped:0 overruns:0 frame:0
          TX packets:1115 errors:0 dropped:0 overruns:0 carrier:0
          collisions:0 txqueuelen:0
          RX bytes:11972 (11.9 KB)  TX bytes:262036 (262.0 KB)

veth92be3da Link encap:Ethernet  HWaddr 72:05:75:a2:00:ca
          inet6 addr: fe80::7005:75ff:fea2:ca/64 Scope:Link
          UP BROADCAST RUNNING MULTICAST  MTU:1500  Metric:1
          RX packets:181816 errors:0 dropped:0 overruns:0 frame:0
          TX packets:181375 errors:0 dropped:0 overruns:0 carrier:0
          collisions:0 txqueuelen:0
          RX bytes:23437842 (23.4 MB)  TX bytes:48355807 (48.3 MB)

virbr0    Link encap:Ethernet  HWaddr 00:00:00:00:00:00
          inet addr:192.168.122.1  Bcast:192.168.122.255  Mask:255.255.255.0
          UP BROADCAST MULTICAST  MTU:1500  Metric:1
          RX packets:0 errors:0 dropped:0 overruns:0 frame:0
          TX packets:0 errors:0 dropped:0 overruns:0 carrier:0
          collisions:0 txqueuelen:1000

root@csp2s22c04:~# brctl show
bridge name     bridge id               STP enabled     interfaces
docker0         8000.02422a85818c       no              veth2764a3d
                                                        veth2fbd63e
                                                        veth92be3da
Stop Running Yardstick Container on the SuT and TG
Finally, Yardstick container is not necessary on the SuT and the TG; therefore, after installing Yardstick NSB on SuT and TG, you may stop Yardstick container on the SuT and TG by issuing the command sudo docker container stop yardstick:
~$ sudo docker container stop yardstick
~$ sudo docker ps
CONTAINER   ID    IMAGE       COMMAND       CREATED     STATUS    PORTS   NAMES
Summary
The first part of this tutorial details how to install Yardstick NSB software on the servers. The Yardstick NSB software also contains the scripts to start NFVs, NFVI, and the TG, which are needed for the SuT and the server that generates packets. Since only the jump server needs to run the NSB tests later, you can disable the Yardstick containers in the TG and the SuT. Continue with Part 2, which covers performance measurement.
References
- Yardstick Network Services Benchmarking: Measure NFVI/VNF Performance (Part 2)
- Install Yardstick on Ubuntu* 14.04: OPNFV Yardstick Project
- Yardstick User Guide (Euphrates): Yardstick User Guide
- ETSI GS NFV-TST 001 (v1.1.1 (2016-04): http://www.etsi.org/deliver/etsi_gs/NFV-TST/001_099/001/01.01.01_60/gs_NFV-TST001v010101p.pdf
- InfluxDB* 1.5 Documentation
- Grafana* website
- Data Plane Development Kit website