Introduction
Yardstick Network Services Benchmarking (NSB) is a test framework for measuring the performance of a Virtual Network Function (VNF) in a Network Function Virtualization (NFV) environment.
We implement a Test System with Yardstick NSB which drives traffic to a System under Test (SUT) and measure SUT’s response. The response is measured both by consuming and measuring traffic received from the SUT (throughput, latency, jitter, dropped packet, etc.) and by collecting measurements from instrument installed in the SUT (CPU, memory, network utilization, etc.).
This tutorial is the second in a two-part series about using Yardstick NSB. Yardstick NSB: Install and Configure to Measure NFVI/VNF Performance Part 1 shows in details how to install Yardstick-NSB on bare metal, where this second tutorial shows how to run Yardstick-NSB for characterizing an NFV infrastructure (NFVI)/VNF.
To perform NFVI characterization, the following components are needed:
- Traffic generator (TG)
- Set of VNFs that will be used for characterization
- NFVI as the SUT
- Set of Key Performance Indicators (KPIs)
- Storage for results and KPI data collection, InfluxDB* is used for this purpose
- Optionally, a data visualization tool such as Grafana*
- Optionally, a packet replay system.
Figure 1 below illustrates the system used in this tutorial including a jump host server used to run the Yardstick NSB software, a server used to generate network traffic (TG) and a server used as an SUT. All three servers use Intel® Xeon® Gold processor 6138 at 2.00GHz and have Ubuntu* 16.04 installed. A switch connects to these three servers via 1-Gigabit Ethernet (GbE) network interface so that admin commands can be sent from the jump server to the TG and the SUT. Two 10 GbE network interface cards (NICs) in the TG are connected directly (back-to-back) to two more 10 GbE NICs in the SUT. In this example we use the Intel® Ethernet Controller X710 10/40 GbE with small form factor pluggable (SFP+) Ethernet cables for both the TG and SUT.
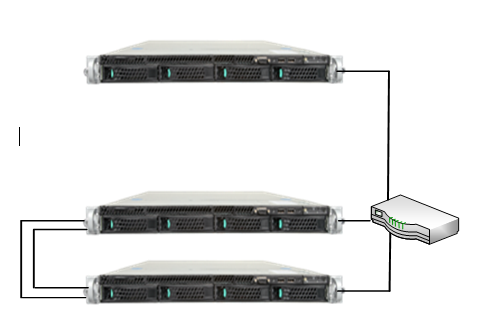
Figure 1. System setup for Yardstick NSB
To execute NFVI and VNF test cases in the jump server, you will need a configuration file that includes the IP address of the TG, SUT; their root passwords; the VPCI of their high-speed NICs and the MAC address of those high-speed NICs.
Note: use the command “lspci -nn | grep Eth” to find device ID (vpci) and then “ifconfig -a” to find MAC address (HWaddr) of the high-speed NICs to fill out the following table. In this example, the root password of all systems are set to “rootpassword”:
Table 1. Summary of information that will be used in the configuration file.
| IP Address | User Name | Password | VPCI | MAC Address | |
|---|---|---|---|---|---|
| Jump Server CSP2S22C04 |
10.23.3.74 | root | rootpassword | N/A | N/A |
| Traffic Generator EB2S20C02 |
10.23.3.73 | root | rootpassword | 0000:86:00:0 0000:86:00:1 |
3c:fd:fe:a0:18:e8 3c:fd:fe:a0:18:e9 |
| SUT EB2S20C01 |
10.23.3.184 | root | rootpassword | 0000:86:00:0 0000:86:00:1 |
3c:fd:fe:a0:0d:70 3c:fd:fe:a0:0d:71 |
Characterize NFVI
From a terminal in the jump server (CSP2S22C04), connect to the Yardstick container:
$ sudo docker exec -it yardstick /bin/bash
To list all available VNFs, from the Yardstick container:
# /home/opnfv/repos/yardstick/yardstick/cmd/NSBperf.py --list-vnfs
VNF:
================
 1: acl
 2: prox
 3: router
 4: firewall
 5: vpe
 6: ping
 7: udp_replay
 8: 2trex
 9: cgnapt
 10: vfw
To list all test cases including bare metal, standalone virtualized and managed virtualization environments:
# /home/opnfv/repos/yardstick/yardstick/cmd/NSBperf.py --list-tests
For NFVI test cases, they are located in the Yardstick container and under the folder /home/opnfv/repos/yardstick/samples/vnf_samples/nsut/prox. PROX is a DPDK application and can generate traffic, used for NFVI characterization. To list only the NFVI test cases for bare-metal only:
# cd /home/opnfv/repos/yardstick/samples/vnf_samples/nsut/prox
# ls –l | grep baremetal
To run a NFVI test case, three files are needed:
- Examine the configuration file
/etc/yardstick/yardstick.conf, and make sure the IP address of Influx is specified correctly (see Yardstick Network Services Benchmarking (NSB): Install and Configure to Measure NFVI/VNF Performance (Part 1)). Also, note that the IP address of Influx can change if you delete the Influx docker image and create it again.
- The test file describes how to execute a test (ramp traffic intensity over the running time of the test until maximum performance is found, changing traffic intensity in a binary search procedure to find the performance maximum). This information is declared as “VNF model”, expressed in a collection of YAML documents, and a traffic model). All the test files start with
tc_. - The context file
prox-baremetal-*.yaml
Note that the Yardstick log file is saved in:/tmp/yardstick/yardstick.log
Examine the test case, and update the context file accordingly. For example, to run test case tc_prox_baremetal_l2fwd-2.yaml, it shows prox-baremetal-2.yaml as the context file. Update this context file using the information about TG and SUT according to the table 1. Also, if a password is provided, “key_filename” field must be commanded out. In this case, since we have a password (e.g., “rootpassword”), we must command out the “key_filename” field.
# cat prox-baremetal-2.yaml

nodes:
-
    name: "tg_0"
    role: TrafficGen
    ip: 10.23.3.73
    user: "root"
    ssh_port: "22"
    password: "rootpassword"
    #key_filename: ""
    interfaces:
        xe0:
            vpci: "0000:86:00.0"
            local_mac: "3c:fd:fe:a0:18:e8"
            driver: "i40e"
            local_ip: "152.16.100.19"
            netmask: "255.255.255.0"
            dpdk_port_num: 0
        xe1:
            vpci: "0000:86:00.1"
            local_mac: "3c:fd:fe:a0:18:e9"
            driver: "i40e"
            local_ip: "152.16.40.19"
            netmask: "255.255.255.0"
            dpdk_port_num: 1
-
    name: "vnf_0"
    role: VNF
    ip: 10.23.3.184
    user: "root"
    ssh_port: "22"
    password: "rootpassword"
    #key_filename: ""
    interfaces:
        xe0:
            vpci: "0000:86:00.0"
            local_mac: "3c:fd:fe:a0:0d:70"
            driver: "i40e"
            local_ip: "152.16.100.21"
            netmask: "255.255.255.0"
            dpdk_port_num: 0
        xe1:
            vpci: "0000:86:00.1"
            local_mac: "3c:fd:fe:a0:0d:71"
            driver: "i40e"
            local_ip: "152.16.40.21"
            netmask: "255.255.255.0"
            dpdk_port_num: 1
    routing_table:
    - network: "152.16.100.20"
      netmask: "255.255.255.0"
      gateway: "152.16.100.20"
      if: "xe0"
    - network: "152.16.40.20"
      netmask: "255.255.255.0"
      gateway: "152.16.40.20"
      if: "xe1"
    nd_route_tbl:
    - network: "0064:ff9b:0:0:0:0:9810:6414"
      netmask: "112"
      gateway: "0064:ff9b:0:0:0:0:9810:6414"
      if: "xe0"
    - network: "0064:ff9b:0:0:0:0:9810:2814"
      netmask: "112"
      gateway: "0064:ff9b:0:0:0:0:9810:2814"
      if: "xe1"
From the Yardstick container, connect to the Server 1 (10.23.3.73) and Server 2 (10.23.3.184) manually to add them in the known hosts:
# ssh root@10.23.3.73
The authenticity of host '10.23.3.73 (10.23.3.73)' can't be established.
ECDSA key fingerprint is SHA256:T6wSlylYWEUKtUsH5VER+D2URL6HPWlkOOgq2sIztDM.
Are you sure you want to continue connecting (yes/no)? yes
Warning: Permanently added '10.23.3.73' (ECDSA) to the list of known hosts.
Doing the same for root@10.23.3.184 too. Depending on your system, you may need to set the following path:
# export PYTHONPATH=/opt/nsb_bin/trex_client:/opt/nsb_bin/trex_client/stl
For example, to run the NFVI tc_prox_baremetal_l2fwd-2.yaml test case (this test case takes packets in from one port and forwards them unmodified to another part), in the Yardstick container:
# yardstick task start tc_prox_baremetal_l2fwd-2.yaml
Every time you run a test case, the Yardstick log is generated in /tmp/yardstick/yardstick.log.
KPIs will be streamed to the InfluxDB database. This data can be retrieved via manual database queries of the data base, or visualized by Grafana.
Characterize a Sample VNF
Similarly, to characterize a sample VNF in bare metal environment, go to a VNF directory, and list all bare-metal VNF test cases:
# cd /home/opnfv/repos/yardstick/samples/vnf_samples/nsut/vfw
# ls –l | grep baremetal
To run a VNF test case, three files are needed:
- Examine the configuration file
/etc/yardstick/yardstick.conf, and make sure that IP address of Influx is specified correctly (see Yardstick Network Services Benchmarking (NSB): Install and Configure to Measure NFVI/VNF Performance (Part 1)). Also, note that the IP address of Influx can change if you delete the Influx Docker image and create it again. - The test file describes how to execute a test (ramp traffic intensity over the running time of the test until maximum performance is found, changing traffic intensity in a binary search procedure to find the performance maximum). This information is declared as “VNF model”, expressed in a collection of YAML documents, and a traffic model). All the test files start with
tc_. - The context file
pod.yaml
For the first time, create the context file pod.yaml:
# mkdir /etc/yardstick/nodes
# cd /home/opnfv/repos/yardstick
# cp ./etc/yardstick/nodes/* /etc/yardstick/nodes
# cp /etc/yardstick/nodes/pod.yaml.nsb.example /etc/yardstick/nodes/pod.yaml
Update this context file /etc/yardstick/nodes/pod.yaml (IP address, root password, vpci, MAC of NICs) using the information about TG and SUT according to the table 1.
# cat /etc/yardstick/nodes/pod.yaml
nodes:
-
    name: trafficgen_1
    role: TrafficGen
    ip: 10.23.3.73
    user: root
    password: rootpassword
    interfaces:
        xe0:  # logical name from topology.yaml and vnfd.yaml
            vpci:      "0000:86:00.0"
            driver:    "i40e"
            dpdk_port_num: 0
            local_ip: "152.16.100.19"
            netmask:   "255.255.255.0"
            local_mac:   "3c:fd:fe:a0:18:e8"
        xe1:  # logical name from topology.yaml and vnfd.yaml
            vpci:      "0000:86:00.1"
            driver:    "i40e"
            dpdk_port_num: 1
            local_ip: "152.16.40.19"
            netmask:   "255.255.255.0"
            local_mac:   "3c:fd:fe:a0:18:e9"

-
    name: vnf
    role: TrafficGen
    ip: 10.23.3.184
    user: root
    password: rootpassword
    host: 10.23.3.184 # BM - Host == ip, Standalone virtualization - Host == compute node
    interfaces:
        xe0:  # logical name from topology.yaml and vnfd.yaml
            vpci:      "0000:86:00.0"
            driver:    "i40e"
            dpdk_port_num: 0
            local_ip: "152.16.100.21"
            netmask:   "255.255.255.0"
            local_mac:   "3c:fd:fe:a0:0d:70"

        xe1:  # logical name from topology.yaml and vnfd.yaml
            vpci:      "0000:86:00.1"
            driver:    "i40e"
            dpdk_port_num: 1
            local_ip: "152.16.40.21"
            netmask:   "255.255.255.0"
            local_mac:   "3c:fd:fe:a0:0d:71"
    routing_table:
    - network: "152.16.100.20"
      netmask: "255.255.255.0"
      gateway: "152.16.100.20"
      if: "xe0"
    - network: "152.16.40.20"
      netmask: "255.255.255.0"
      gateway: "152.16.40.20"
      if: "xe1"
    nd_route_tbl:
    - network: "0064:ff9b:0:0:0:0:9810:6414"
      netmask: "112"
      gateway: "0064:ff9b:0:0:0:0:9810:6414"
      if: "xe0"
    - network: "0064:ff9b:0:0:0:0:9810:2814"
      netmask: "112"
      gateway: "0064:ff9b:0:0:0:0:9810:2814"
      if: "xe1"
To run a VNF test case in the Yardstick container, for example, tc_baremetal_rfc2544_ipv4_1rule_1flow_64B_trex.yaml:
# yardstick task start tc_baremetal_rfc2544_ipv4_1rule_1flow_64B_trex.yaml
While the test case is running, you can use the command “top” to show the VNF and the traffic generator running on the SUT and the TG server respectively.

Figure 2. Top command shows the VNF, vFW in this case, is running on the SUT.
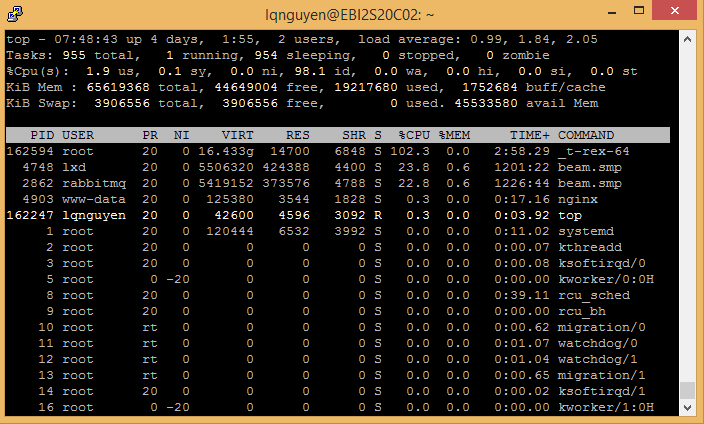
Figure 3. Top command shows the traffic generator _t-rex-64 is running on the TG server.
Show Results Using InfluxDB*
After the test case complete, you can use Influx container to see the results. The following example shows the results after the above NFVI test case completed. From the command prompt, connect to the Influx container:
$ sudo docker ps
CONTAINER ID        IMAGE                    COMMAND                  CREATED             STATUS              PORTS                                            NAMES
e52a6011aedd        grafana/grafana:4.4.3    "/run.sh"                2 months ago        Up 2 months         0.0.0.0:1948->3000/tcp                           nostalgic_spence
263a12ba0909        tutum/influxdb:0.13      "/run.sh"                2 months ago        Up 2 months         0.0.0.0:8083->8083/tcp, 0.0.0.0:8086->8086/tcp   clever_jones
5c9627810060        opnfv/yardstick:stable   "/usr/bin/supervisord"   2 months ago        Up 2 months         5000/tcp, 5672/tcp
$ sudo docker exec -it clever_jones /bin/bash
root@263a12ba0909:/#
root@263a12ba0909:/# influx
Visit https://enterprise.influxdata.com to register for updates, InfluxDB server management, and monitoring.
Connected to http://localhost:8086 version 0.13.0
InfluxDB shell version: 0.13.0


> SHOW DATABASES
name: databases
---------------
name
yardstick
_internal

> use yardstick
Using database yardstick

> SHOW QUERIES
qid     query           database        duration
30      SHOW QUERIES    yardstick       29999u

> show measurements
name: measurements
------------------
name
cpu
tc_baremetal_rfc2544_ipv4_1rule_1flow_64B_packetsize
tc_baremetal_rfc2544_ipv4_1rule_1flow_64B_trex
tc_baremetal_rfc2544_ipv4_1rule_1flow_64B_trex_scale_up
tc_baremetal_rfc2544_with_latency_ipv4_1rule_1flow_64B_trex
tc_prox_baremetal_acl-2
tc_prox_baremetal_binsearch-2
tc_prox_baremetal_buffering-1
tc_prox_baremetal_l2fwd-2
tc_prox_baremetal_l2fwd_multiflow-2
tc_prox_baremetal_mpls_tagging-2


> SHOW FIELD KEYS
…………………………………
vnf__0.collect_stats.core.memory.memory-used
vnf__0.collect_stats.core.timestamp
vnf__0.curr_packets_fwd
vnf__0.curr_packets_in
vnf__0.packets_dropped
vnf__0.packets_fwd
vnf__0.packets_in

> SHOW MEASUREMENTS
name: measurements
------------------
name
cpu
tc_baremetal_rfc2544_ipv4_1rule_1flow_64B_trex
tc_baremetal_rfc2544_with_latency_ipv4_1rule_1flow_64B_trex
tc_prox_baremetal_binsearch-2
tc_prox_baremetal_buffering-1
tc_prox_baremetal_l2fwd-2
tc_prox_baremetal_l2fwd_multiflow-2
tc_prox_baremetal_mpls_tagging-2
(select <field keys> from <measurement>)
> select tg__0.CurrentDropPercentage,tg__0.DropPercentage from tc_baremetal_rfc2544_ipv4_1rule_1flow_64B_packetsize
name: tc_baremetal_rfc2544_ipv4_1rule_1flow_64B_packetsize
----------------------------------------------------------
time                    tg__0.CurrentDropPercentage     tg__0.DropPercentage
1532128948394615040     0.13737                         0.13737
1532128988494863104     0.13882                         0.13882
1532129028592649984     0.13311                         0.13311
1532129068691358976     0.00638                         0.00638
1532129108793801984     0.00211                         0.00211
1532129148888868096     0                               0
1532129188989790976     0                               0
1532129229084641024     0.00199                         0
1532129269165895936     0                               0
1532129309265240832     0.00198                         0
Print the last 5 minutes, group by 10 seconds
> select last(tg__0.PktSize) from "tc_prox_baremetal_l2fwd-2" where time > now() - 300s group by time(10s)
Another way
> select * from "tc_prox_baremetal_l2fwd-2" limit 1


root@5c9627810060:# cd /home/opnfv/repos/yardstick/samples/vnf_samples/nsut/prox
root@5c9627810060:# /home/opnfv/repos/yardstick/yardstick/cmd/NSBperf.py --vnf prox --test tc_prox_baremetal_l2fwd-2.yaml
To display with readable time:
> precision rfc3339
> SELECT tg__0.PktSize, tg__0.RxThroughput FROM "tc_prox_baremetal_l2fwd-2"
> SELECT vnf__0.packets_in,vnf__0.packets_fwd FROM "tc_prox_baremetal_l2fwd-2"
> SELECT tg__0.RxThroughput, vnf__0.packets_in, vnf__0.packets_fwd FROM "tc_prox_baremetal_l2fwd-2"
To display last entries:
> SELECT last(tg__0.RxThroughput),vnf__0.packets_in, vnf__0.packets_fwd FROM "tc_prox_baremetal_l2fwd-2"
Display the last entries, grouped by 10 seconds interval:
> SELECT last(tg__0.RxThroughput),vnf__0.packets_in, vnf__0.packets_fwd FROM "tc_prox_baremetal_l2fwd-2" WHERE time > now() - 1h group by time(10s)
Visualize Results Using Grafana* Dashboard (Optional)
To visualize results using Grafana dashboard:
- Open a browser in the jump host, open
http://10.23.3.155:1948 - Load prebuild dashboards for the NFVi test (Grafana logo -> dashboards -> Import
- Click on "Upload .json File" box
- Choose Prox_BM_L2FWD-2Port-1507804... file (the corresponding file to the test case), click "Open"
- Select "yardstick" box, and click "Import"
- In the top right click time, to change, says 5 minutes
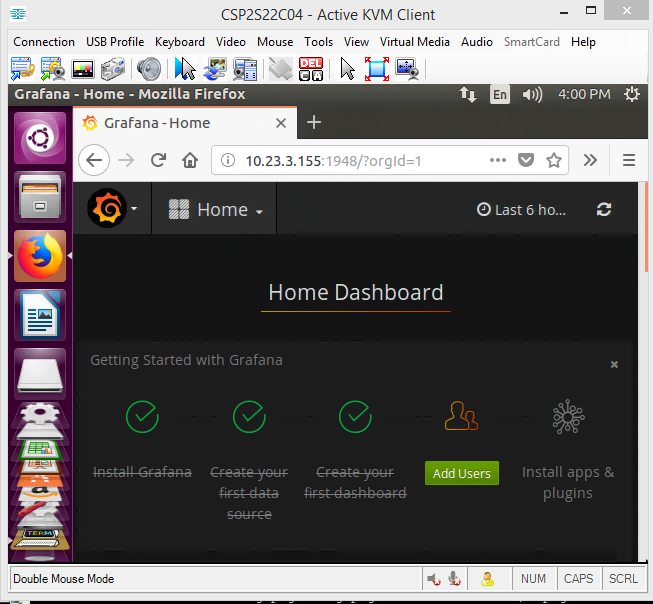
Figure 4. Open a browser in the jump host, open http://10.23.3.155:1948
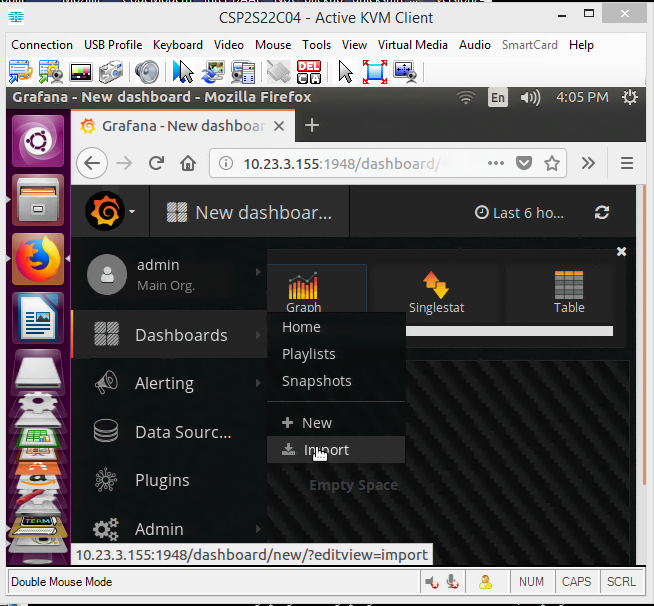
Figure 5. Load prebuild dashboards for the NFVI test (Grafana logo -> dashboards -> Import. Click on "Upload .json File" box.
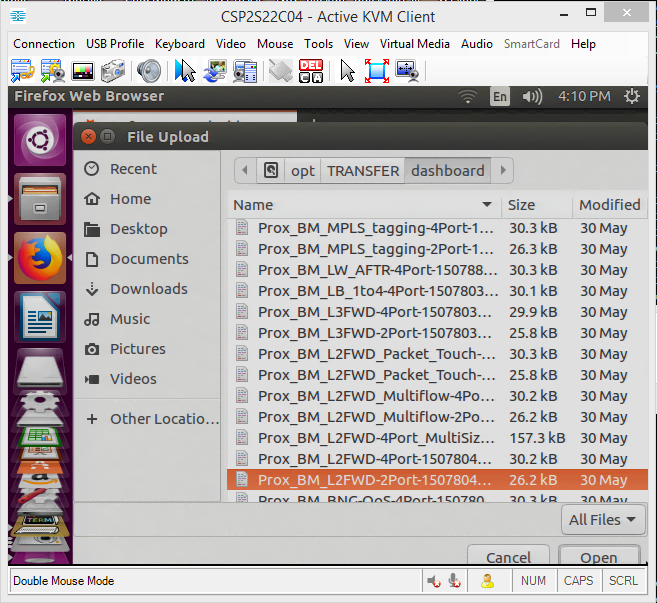
Figure 6. Choose Prox_BM_L2FWD-2Port-1507804... file (the corresponding file to the test case), click "Open"
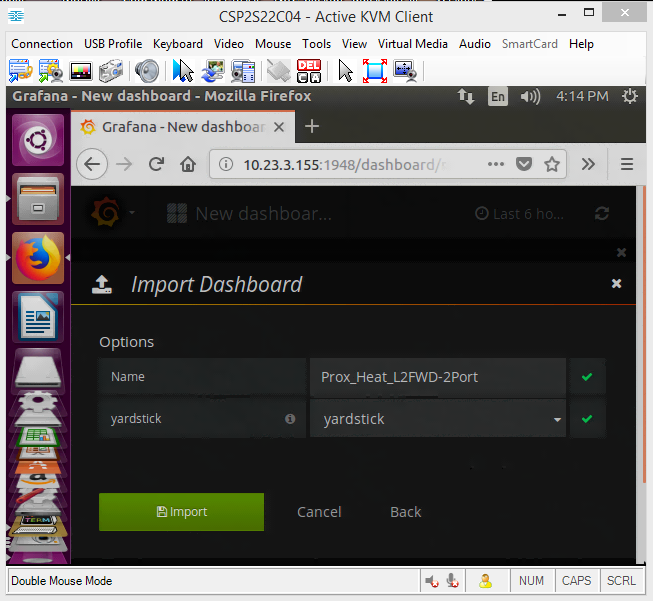
Figure 7. Select "yardstick" box, and click "Import"
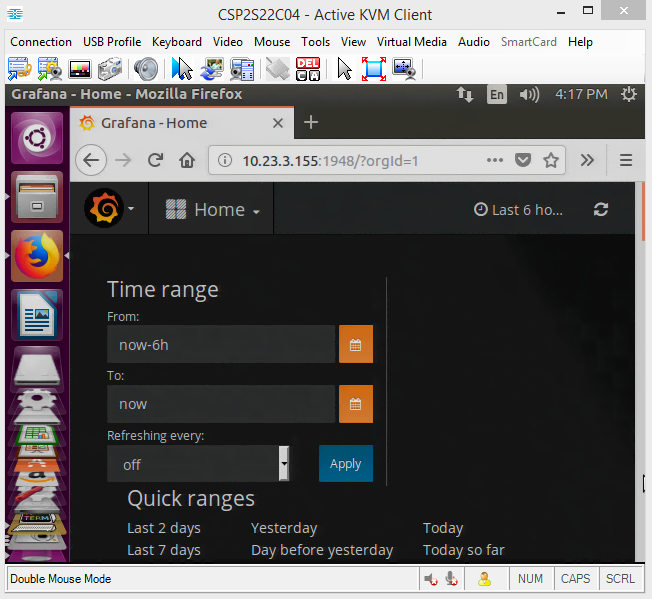
Figure 8. In the top right click time, to change, says 5 minutes
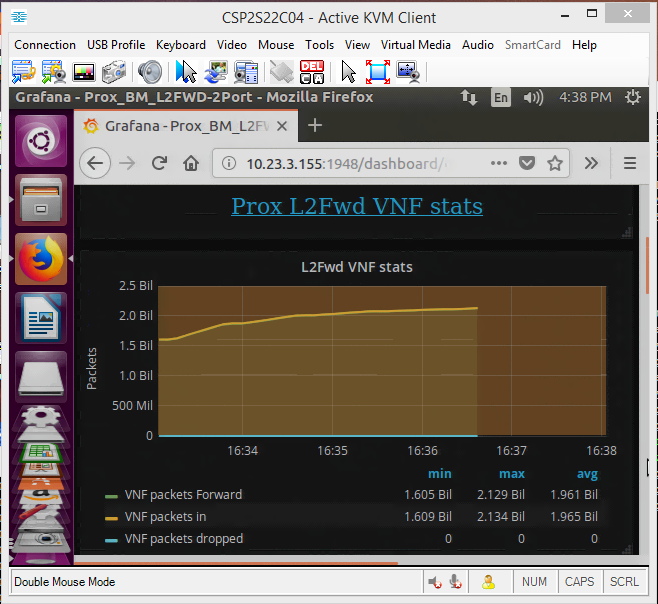
Figure 9. The results are showed.
Summary
Part two of the series on Yardstick NSB explains in detail how to run the software for characterizing an NFVI/VNF on bare metal. This tutorial also shows how to connect to the InfluxDB container to retrieve data and how to use the Grafana dashboard to visualize the results. For installation, refer back Yardstick NSB: Install and Configure to Measure NFVI/VNF Performance (Part 1).
References
Yardstick Network Services Benchmarking: Measure NFVI/VNF Performance (Part 1)
OPNFV Yardstick Network Service Benchmarking
Quick Start Guide for Running Yardstick*/NSB for NFVI Characterization – Version 1
Getting Started with the InfluxDB CLI and Configuration Options - YouTube