1 Introduction
Intel® Data Direct I/O Technology (Intel® DDIO) is available in current Intel® Xeon® processors. It enables I/O devices such as network interface controllers (NICs), disk controllers, and other peripherals to access the CPU's last-level cache (LLC). Direct access to LLC can drastically increase performance due to lower latencies, CPU utilization, and higher bandwidth.
The Intel® DDIO feature is transparent to software, meaning that software does not need to be modified to utilize it. Since the software is unaware of Intel® DDIO, how can one determine if and how effectively it is being used, and how can it be optimized to improve I/O performance?
This paper details how to use the available set of Intel Performance Monitoring (PerfMon) events and metrics to determine if and how effectively Intel® DDIO technology is being used. It will cover suggestions on how to improve the utilization of Intel® DDIO.
This paper's content is specific to 4th Generation Intel® Xeon® Scalable Processors (formerly known as Sapphire Rapids) and 5th Generation Intel® Xeon® Scalable Processors (formerly known as Emerald Rapids); however, many of the concepts apply to previous Intel® Xeon® class processor generations.
This paper does not cover the details of how to program uncore PerfMon events; please see the 4th Gen Intel® Xeon® Scalable Processor XCC Uncore Performance Monitoring Programming Guide [1] for this programming information. This paper does not cover cross-socket I/O flows; all flows discussed illustrate local traffic on one socket.
The PerfMon events referenced in this paper can be found in JSON format at the Intel® performance monitoring GitHub [2] in the SPR directory.
2 Architecture Background
2.1 4th Generation Intel® Xeon® Scalable Processors Platform Overview
While other documents provide a platform and architecture overview with a similar picture, to establish common ground, we will start with a high-level overview of the 4th Generation Intel® Xeon® Scalable Processors in the figure below. 4th Generation Intel® Xeon® Scalable Processors, like previous Intel® Xeon® Scalable Servers, implements a tile layout where various blocks are grouped onto tiles and placed in grid vertices. These grid vertices connect to a mesh interconnect, allowing blocks to be interconnected through a common mesh fabric. The tile layout is SKU-specific; the figure below represents one possible layout or SKU.
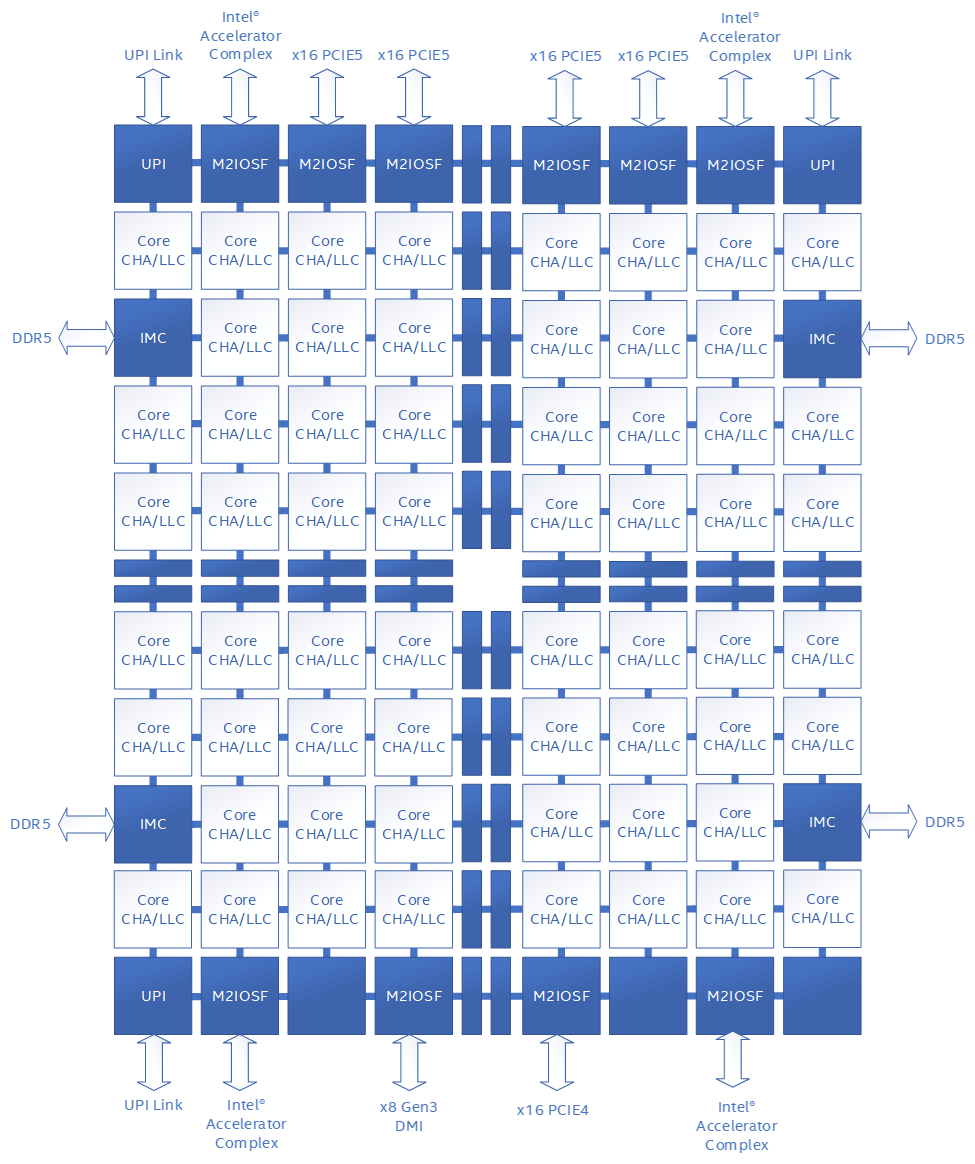
Figure 1: 4th Generation Intel® Xeon® Scalable Processors XCC High-level Block Diagram
Key agents that communicate through the mesh to other agents and blocks include:
- Core: Central Processing Unit (CPU) containing local level 1 (L1) and level 2 (L2) caches. Each core communicates with the uncore and LLC through the mesh.
- CHA/LLC: Caching and Home Agent connects to the mesh and is the cache controller that handles all coherent memory requests in the uncore and maintains memory consistency across the system. Each CHA contains a Last Level Cache (LLC) “slice.” Memory addresses are hashed across the available CHAs, so a request from a core or I/O device will be directed to the appropriate CHA unit based on the physical address. Note that this means there is no inherent affinity for a memory request from a core to go to its co-located CHA or LLC slice. The CHA is a critical PerfMon observation point for I/O analysis and Intel® DDIO effectiveness, as this is where we can count I/O requests and observe LLC hits and misses for the socket.
- M2IOSF: The Mesh to I/O Scalable Fabric connects to the mesh and is the interface between the CPU and I/O devices connected through a PCI Express slot or integrated on die. The M2IOSF is an observation point where we can count I/O request types per M2IOSF block or PCIE device. The M2IOSF contains multiple sub-blocks with performance monitoring units (PMUs). The M2IOSF serves the same bridging function for Compute Express Link® (CXL) devices, but these blocks and flows are not shown or discussed here.
- IIO: Integrated I/O unit consisting of an inbound and outbound traffic controller for queueing requests; it is responsible for following PCI Express ordering rules and converting PCI Express requests to internal commands for IRP and vice-versa. The IIO PMU provides per device resolution (up to x4 bifurcation). In this context, “inbound” refers to I/O device-initiated requests sent to the CPU (also called upstream), while “outbound” refers to CPU-initiated requests sent to the I/O device (also called downstream).
- IRP: IIO to Ring Port unit, sometimes called the cache tracker, is responsible for converting IIO requests (from PCIe/CXL or integrated accelerator agents) to mesh requests and vice versa. The IRP contains a local write cache that is used for accelerating inbound write requests. This cache should not be confused with processor L1, L2 caches, or the CHA LLC and can be thought of as a temporary write buffer. The IRP PMU provides per M2IOSF resolution, not per device like the IIO.
- M2PCIE: Mesh to PCI Express unit, bridges the mesh and IRP.
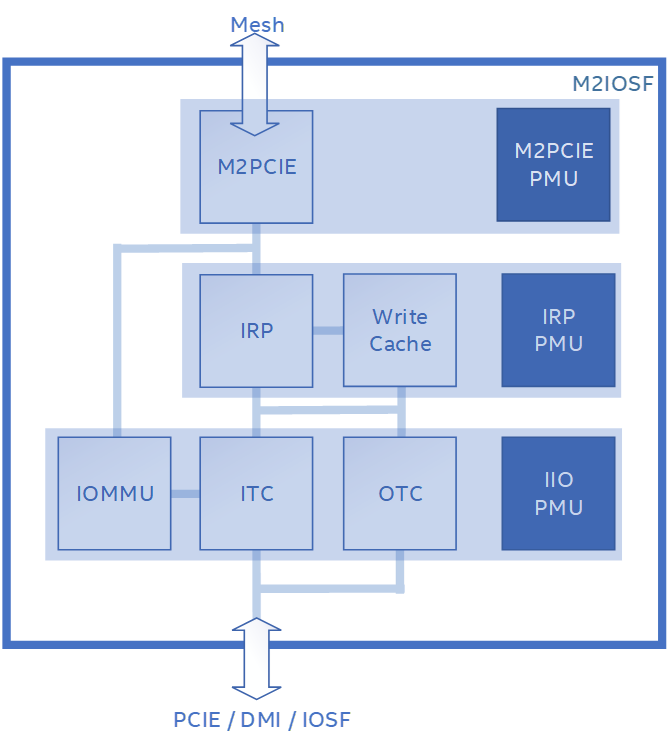
Figure 2: M2IOSF block diagram
- IMC: Integrated Memory Controller that handles all access to DDR.
- UPI: Intel Ultra Path Interconnect, a high-speed interconnect used in multi-socket server configurations to connect multiple sockets together.
2.2 Intel® DDIO Overview (w/ high level transactions)
Intel® DDIO allows I/O devices to perform direct memory access (DMA) transactions, including inbound reads and inbound writes to the CPU’s LLC instead of DRAM. This has multiple benefits: improving transaction latencies observed by the I/O device, reducing demand on system memory, and improving data read latencies observed by the data consumers, such as CPU cores or accelerators. Intel® DDIO applies to most I/O devices attached to the system I/O ports as well as built-in devices such as accelerators.
In systems with multi-level memory hierarchy, accesses to data residing in higher cache layers enjoy lower latencies than accesses to DRAM. In systems without Intel® DDIO (prior to Intel® Xeon® processor E5 family and Intel® Xeon® processor E7 v2 family), inbound DMA writes terminate in system memory, resulting in relatively longer latency experienced by the consumers of the data. With Intel® DDIO, the inbound writes are allocated in CPU’s LLC, allowing the consumers to get the data much quicker.
In Intel architecture, inbound transactions initiated by the device pass through the integrated I/O controller, which serves as the CPU’s coherent domain interface. M2IOSF negotiates the transaction with CHAs, which also contain slices of the CPU’s LLC cache. During this negotiation, in some scenarios, M2IOSF may request temporary speculative ownership of the cache line, holding on to it for the duration of the transaction if possible. Maximum granularity of Intel® DDIO transactions is one cache line (64 bytes), but data sizes smaller than 64B are allowed and are known as partial transactions. M2IOSF is tasked with breaking up larger transactions into cache line granularity.
Inbound I/O memory read and write transactions are coherent and the coherence is handled by the CHAs. The CHAs are responsible for looking up the data in the LLC or other system caches, accessing system memory, issuing snoops to other caching agents, and otherwise maintaining data coherence. Each CHA contains a slice of the LLC and a queue called “Table Of Requests” (TOR). All data and control messages in the mesh pass through the TOR in the CHA; the destination CHA for any memory transaction is determined by the hash of the memory address of that transaction. The TOR in each CHA unit is an ideal observation point for monitoring data movement in the mesh with hardware PMON counters.
Inbound I/O transactions with Intel® DDIO enabled behave similarly to cache transactions initiated by CPU cores. An I/O transaction results in a cache hit when the target address is found in one or more of the system’s caches; otherwise, a cache miss is observed.
A high-level inbound I/O transaction flow can be described as follows:
- An I/O device initiates the inbound read request or inbound write transaction.
- M2IOSF divides the transaction into 64B chunks, if necessary, and forwards the transaction to the CHAs.
- The CHAs check for cache hit or miss and perform the necessary coherence operations such as snoops. In the data read case, the CHA is also responsible for fetching the data from its current location, such as a caching agent, another socket, or memory.
- In the data read case, the CHA sends data back to the Integrated I/O controller.
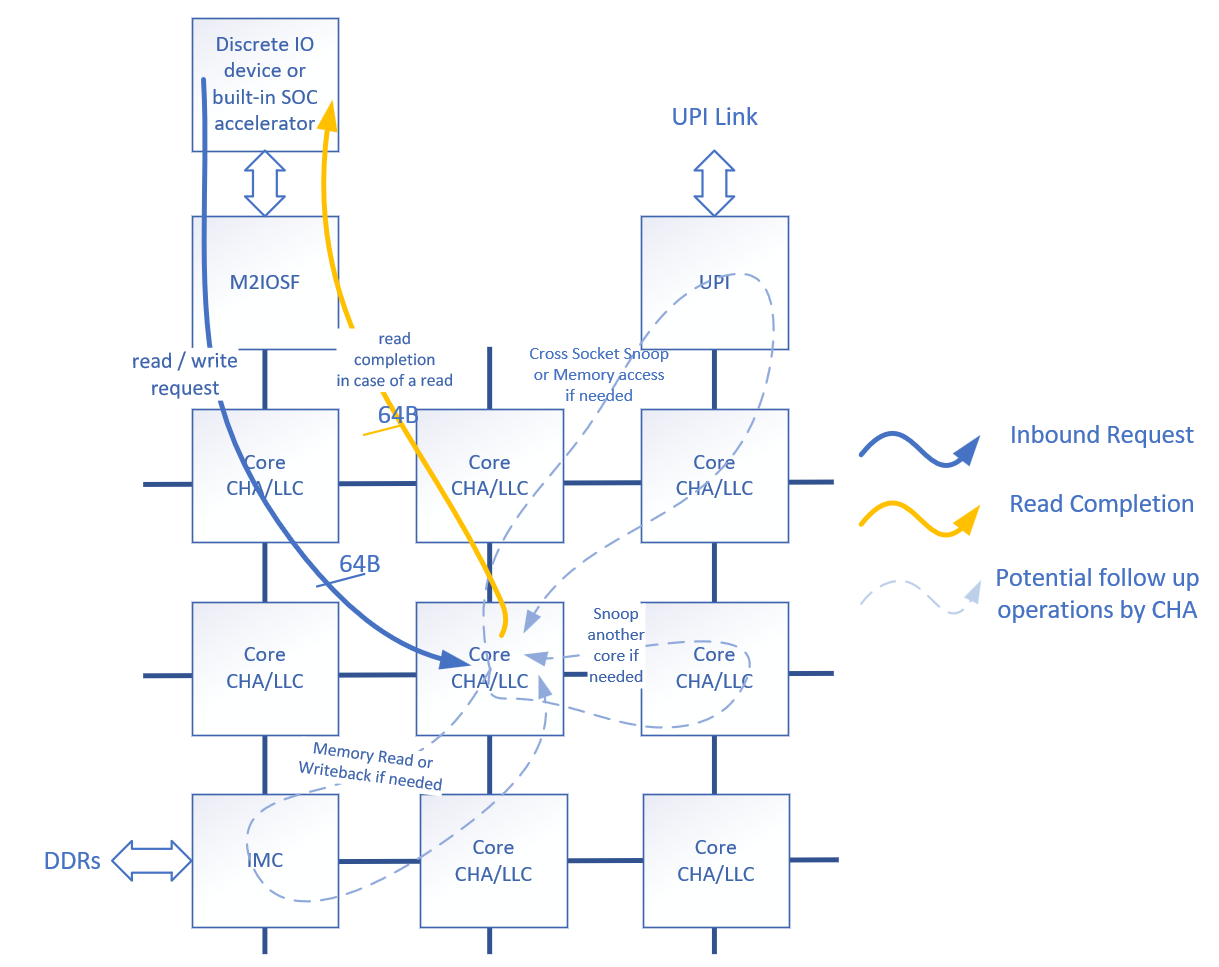
Figure 3: High-Level Inbound I/O Transaction Flow Diagram
Inbound transactions can be classified as reads or writes, LLC hits or misses, and full or partial transactions. Writes can further be classified into allocating (BIOS default) and non-allocating. In the following sections, we describe how the different types of inbound transactions are handled by IIO and the CHAs.
2.2.1 Inbound Writes
2.2.1.1 Inbound Writes Overview
From the perspective of M2IOSF, inbound writes consist of two phases: ownership and data writeback. In the ownership phase, M2IOSF sends the request for ownership with an ITOM or ITOMCacheNear opcode to the CHA, and the CHA responds by giving the ownership of the targeted cache line to M2IOSF and updating the snoop filter accordingly. As with non-IO operations, giving the ownership of a cache line to M2IOSF requires that other owners of the cache line are notified via snoops to invalidate their copy, following the MESIF coherence protocol. After the ownership phase, M2IOSF sends the data message MTOI to the same CHA. The CHA looks up the data in the LLC and determines whether an LLC hit or an LLC miss needs to be serviced. The following sections describe how the CHA handles LLC hit and LLC miss scenarios.
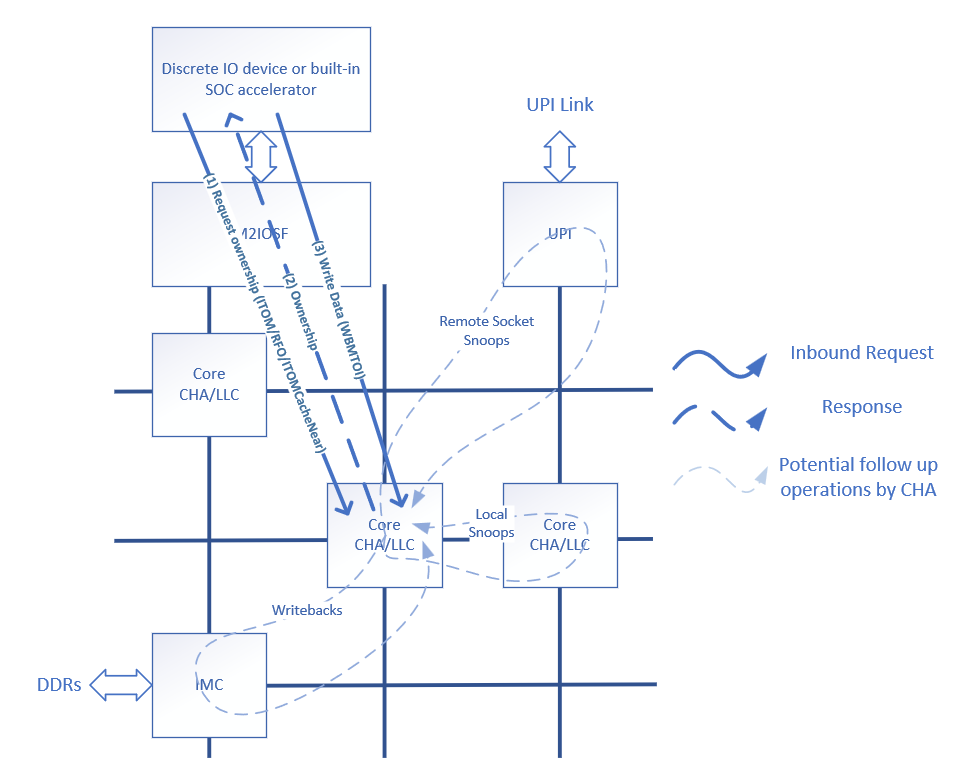
Figure 4: Inbound Write Transaction Diagram. Inbound Writes Consist of Ownership Phase (1-2) and Writeback Phase (3).
2.2.1.2 Inbound Write LLC Hit
LLC hit is the most desirable outcome of an inbound write as it typically results in the lowest overhead the CPU has to incur to service the write. In the event of an LLC hit the CHA simply updates the cache line in the LLC. For full cache line transactions, the entire cache line is overwritten with the new data; for partial cache line transactions, the cache line is merged inside the CHA.
While LLC hit is the simplest outcome of the inbound write, if copies of the data were also found in other caching agents, such as cores or a cache in another CPU socket, a snoop operation is required to invalidate the data from these caching agents to maintain coherence.
2.2.1.3 Inbound Write LLC Miss
In case of an LLC miss, a copy of the data may be present in another cache, such as another core’s local caches or another CPU socket LLC. While processing LLC miss, the CHA determines the location of the data by various means, such as checking the snoop filter, then proceeds to snoop the data if needed. Once these coherency operations have been completed, if the write operation is allocating, the CHA allocates the new data in its LLC. Allocating writes are the most common inbound I/O write scenario; see section 2.3.1.4 for non-allocating writes.
As with other cache allocations, if the LLC has no available cache line slots (invalid lines) to allocate the new inbound I/O write data, the CHA makes room by evicting older data to memory. In case the victimized cache line was dirty, the eviction will result in a memory write and other coherence operations if necessary.
Similar to an inbound LLC hit, if the inbound write is partial, the data is merged with a previous copy of the data. In this case, the previous copy of the data is fetched from memory or another cache.
2.2.1.4 Non-Allocating Inbound Writes
The 4th Generation Intel® Xeon® Scalable Processor and 5th Generation Intel® Xeon® Scalable Processor offers multiple methods to designate all or a portion of inbound I/O writes as non-allocating. This can be achieved either through BIOS or by adjusting the relevant TPH bit in the PCIe transaction TLP header.
Full non-allocating writes bypass the LLC and there is no allocation into the LLC, even as a temporary measure. Partial non-allocating writes temporarily allocate into the LLC for data merging purposes. In this case, once the data merging is complete the full cache line in the LLC is released and written to memory.
2.2.1.5 IO LLC Ways
In CPUs that support Intel® DDIO, a model-specific register (MSR) named IO_LLC_WAYS is present. This register allows users to regulate the size of the segment of the LLC where new inbound I/O write data can be allocated. By default, only a limited section of the LLC is available for fresh allocations; this helps to safeguard valuable application data from being displaced from the LLC by I/O data. Detailed specifications of this register are provided in platform-specific documentation.
2.2.2 Inbound Reads
2.2.2.1 Inbound Reads Overview
Inbound I/O read transactions also benefit from Intel® DDIO as it allows the device to read the data from system caches as opposed to system memory, resulting in latency reduction and memory demand savings. Inbound I/O read requests do not intrinsically result in LLC allocations. However, they must follow the coherence protocol of the platform, which may need to allocate data into LLC following a snoop. As with inbound write requests, read requests can hit or miss LLC.
2.2.2.2 Inbound Reads LLC Hit
Inbound read requests are initiated by M2IOSF and target a specific CHA determined by the destination address's hash. The CHA looks up the data in LLC and, if the data is present, returns the full cache line to the requestor M2IOSF. M2IOSF does not keep a copy of the cache line, so no snoop filter update is necessary.
2.2.2.3 Inbound Read LLC Miss
If the CHA did not find the requested data in LLC, it must be found elsewhere in the system. This can be a core’s local cache, or a cache in another socket, or system memory. CHA looks up the snoop filter to determine if the data is available in another core’s cache and reads the memory to determine if it’s present in another socket. By default, if data is read from memory, it is not cached in LLC.
2.3 Performance Monitoring Overview
2.3.1 Introduction
The Intel Performance Monitoring feature includes a large set of registers called performance monitoring counters (PMC) that software can program to count a specified “hardware event.” These PMCs are distributed throughout the architecture, including the blocks shown in Figure 1: Core, CHA, M2IOSF, UPI, IMC, and more. By “hardware event,” we refer to an activity that occurs in that block that is interesting to monitor. For example, in the core, PMCs can count the number of instructions retired, branch predictions and cache hits.
2.3.2 Intel® PerfMon GitHub
Intel® publishes PerfMon event and metric information for all supported platforms on its Performance Monitoring GitHub [2]. In the SPR folder, the event folder contains three files containing event programming information:
- sapphirerapids_core.json: Core and Off Core Response (OCR) events
- sapphirerapids_uncore.json: Tested uncore events
- sapphirerapids_uncore_experimental.json: uncore events that have not been tested; “use at your own risk”.
These three files contain all the available PerfMon events for 4th Generation Intel® Xeon® Scalable Processors and event programming information for software tools. Events for the 5th Generation Intel® Xeon® Scalable Processors are available under the EMR directory.
There is also a metric folder, containing a JSON file with useful metrics that make performance analysis easier by turning raw event counts into human-readable units of measure like GHz, MB/S, or nanoseconds. These metrics can be used by custom PerfMon tools and are also available in “Linux perf stat” via the -M option.
2.3.3 PerfMon Event Naming Conventions
It is helpful to understand the uncore PerfMon event naming convention used for defining a countable event, so that one can determine where in the architecture the monitoring is occurring from the event name or from which unit’s perspective.
Each event definition in the JSON file has a field “EventName” which assigns a human readable string to a specific set of values that software programs into the PerfMon control registers. The event name starts with “UNC” to indicate this is an uncore event (rather than a core event). Following “UNC” is an acronym or letter to indicate which unit in the uncore this event belongs to. This quickly tells us if we observe counts in the memory controller, UPI link, or CHA. Below is the key for the acronyms used:
- CHA: the LLC Coherency engine and home agent
- M2IOSF:
- IIO: the integrated I/O inbound and outbound traffic controllers (ITC/OTC)
- I: short for IRP, the IIO to ring port or I/O cache tracker
- M2M: the mesh to memory unit
- M2P: short for M2PCIe, the mesh to PCIe unit
- M3UPI: the interface between the mesh and the Intel® UPI Link Layer
- MDF: bridges multiple dies with an embedded bridge system
- P: short for PCU, the power control unit
- U: short for UBOX, the system configuration controller
- UPI: the Intel® UPI Link Layer unit
- M: short for IMC, the integrated memory controller
The remainder of the event name briefly describes what this event ID counts. There is often a period in the name which usually indicates that several events share the same event ID but use different umask values. For example, the event name “UNC_M_CAS_COUNT.RD” tells us this is an uncore event, counting in the integrated memory controller and is counting CAS commands that are read transactions.
Note that the events defined in the “4th Gen Intel® Xeon® Scalable Processor Uncore Performance Monitoring Programming Guide” [1] do not contain this leading UNC and unit acronym in front of the event name.
2.3.4 Understanding IIO Event Parts
While on the topic of event naming conventions, it is worth calling out the set of IIO events that end with “.partn” where n is a number between 0 to 7, for example “UNC_IIO_DATA_REQ_OF_CPU.MEM_WRITE.PART0”. The M2IOSF can support up to two IOSF ports, and these “part” events allow us to monitor various PCIE bifurcation configurations across the two ports, up to a x4 PCIE lane resolution. Parts 0-3 map to the first x16 port, and parts 4-7 map to the second x16 port. For example, if the first port is connected to a 4x4 configuration and traffic is being sent on all 4 links then events for parts 0-3 will increment accordingly. It is common for only one port to be connected. In this case, the parts connected to the non-operational port will return a count of zero.
The following picture shows how these parts map to possible bifurcations of a x16 PCIe link.
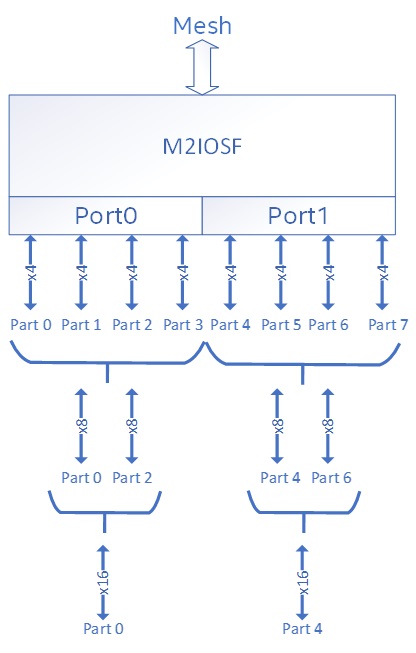
Figure 5: PCIE Parts Mapping
If you monitor a PCIE x16 device, you can expect event counts to show on event PART0 (or PART4 if the slot is connected to the second port). In a 2x8 configuration, counts will show on PART0 and PART2.
3 Observing Intel® DDIO with PerfMon
Since the Intel® DDIO feature is transparent to software, performance monitoring is the only method to show how effectively Intel® DDIO is utilized and aiding in optimization. While different monitoring tools may represent or display Intel® DDIO data in various ways, they all utilize the PerfMon events detailed in this section.
3.1 CHA Unit PerMon
The caching home agents in the uncore are at the heart of Intel® DDIO since they manage the caching behavior for Intel® DDIO flows. The PerfMon events from these CHA units can report if I/O requests are hitting or missing the cache. This is the key indicator of how effectively Intel® DDIO is utilized for the workload under analysis. The CHA unit events provide socket level information and do not provide per I/O device resolution. Although each CHA accumulates PerfMon counts individually, they can be summed together to generate a socket or system level view.
3.1.1 Events
When a CHA unit receives a request from an agent such as a core or I/O device, it places that request in its request queue called “table of requests” (TOR). A set of events associated with this TOR provide information about that request, such as which type of agent the request came from, the request type, and if the request was satisfied from caches (cache hit) or not (cache miss). These events are the UNC_TOR_INSERTS events.
The following list details the most useful UNC_TOR_INSERTS events for Intel® DDIO analysis. For additional event details and the full list of UNC_TOR_INSERTS events, please see the JSON event definition file at the Performance Monitoring GitHub Location. [3]
In the descriptions below, “local” refers to requests received by the CHA that were sent by an agent on the same socket. “IO” refers to any agents connected to M2IOSF, such as PCIE devices and integrated accelerators. In the TOR_INSERTS events below, a “HIT” means that the requested cache line was found in any cache on this socket, including L1, L2, and LLC. For simplicity, it is referred to as a cache hit or even an LLC hit.
|
Event Name |
Description |
|---|---|
|
UNC_CHA_TOR_INSERTS.IO_PCIRDCUR |
Counts the total number of read requests made by local I/O that have been inserted into the TOR. These are full cache-line read requests to get the most current data and do not change the existing state in any cache. Even if the I/O agent requests a partial cache-line read, a full cache-line is read from coherent memory to satisfy this request. |
|
UNC_CHA_TOR_INSERTS.IO_HIT_PCIRDCUR |
Counts the number of IO_PCIRDCUR requests that hit in cache. |
|
UNC_CHA_TOR_INSERTS.IO_MISS_PCIRDCUR |
Counts the number of IO_PCIRDCUR requests that miss cache. |
|
UNC_CHA_TOR_INSERTS.IO_ITOM |
Counts the total number of full cache-line write requests made by local I/O that have been inserted into the TOR. ItoM, or “Invalid to be Modified,” is a request for cache-line ownership without the need to move data to the requesting agent with a read for ownership (RFO). |
|
UNC_CHA_TOR_INSERTS.IO_HIT_ITOM |
Counts the number of full cache-line write requests that hit in cache. |
|
UNC_CHA_TOR_INSERTS.IO_MISS_ITOM |
Counts the number of full cache-line write requests that miss cache. |
|
UNC_CHA_TOR_INSERTS.IO_ITOMCACHENEAR |
Counts the total number of partial cache-line write requests made by local I/O that have been inserted into the TOR. Like ITOM requests, this is a request for cache-line ownership without the need to move data to the requesting agent. |
|
UNC_CHA_TOR_INSERTS.IO_HIT_ITOMCACHENEAR |
Counts the number of partial cache-line write requests that hit in cache. |
|
UNC_CHA_TOR_INSERTS.IO_MISS_ITOMCACHENEAR |
Counts the number of partial cache-line write requests that miss cache. |
|
UNC_CHA_TOR_INSERTS.IO_WBMTOI |
Counts the total number of modified data writebacks from local I/O that have been inserted into the TOR. Each writeback transaction is one cache line. The data writeback phase occurs after the write request phase (ItoM) and applies to both partial and full cache-line writebacks. |
|
UNC_CHA_TOR_INSERTS.IO_CLFLUSH |
Counts the number of requests from local I/O to invalidate copies of the specified cache line. If the cache line that is requested for flush is in a modified state, it will result in a write-back to memory. CLFLUSH requests occur when configured for non-allocating writes, indicating that Intel® DDIO is disabled. |
Table 1: CHA TOR INSERT I/O Events for Intel® DDIO
Each of the TOR_INSERT events in the table above has a corresponding TOR_OCCUPANCY event. The occupancy event increments by the number of entries in the TOR every clock cycle and can be used to determine the average number of pending requests queued in the TOR. For example, if there are 5 pending PCIRDCUR requests in the TOR for 10 cycles, then UNC_CHA_TOR_OCCUPANCY.IO_PCIRDCUR will increment by 50 during those 10 cycles. The pair of events can be used to get an average of how long requests are in the queue. Event UNC_CHA_CLOCKTICKS can be used along with the occupancy events to determine the average TOR queue depth per request type.
3.1.2 Metrics
The following metrics can be used to simplify PerfMon event counts into a more human-readable result for analyzing the effectiveness of Intel® DDIO caching:
|
Metric Name |
Formula |
Description |
|---|---|---|
|
io_percent_of_inbound _reads_that_miss_l3 |
100 * (UNC_CHA_TOR_INSERTS.IO_MISS_PCIRDCUR / UNC_CHA_TOR_INSERTS.IO_PCIRDCUR) |
Percentage of inbound reads initiated by end device controllers that miss the LLC |
|
io_percent_of_inbound _full_writes_that_miss_l3 |
100 * (UNC_CHA_TOR_INSERTS.IO_MISS_ITOM / UNC_CHA_TOR_INSERTS.IO_ITOM) |
Percentage of inbound full cache-line writes initiated by end device controllers that miss the LLC |
|
io_percent_of_inbound _partial_writes_that_miss_l3 |
100 * (UNC_CHA_TOR_INSERTS.IO_MISS_ITOMCACHENEAR / UNC_CHA_TOR_INSERTS.IO_ITOMCACHENEAR) |
Percentage of inbound partial cache line writes initiated by end device controllers that miss the LLC |
Table 2: CHA Intel® DDIO PerfMon Metrics
3.2 M2IOSF Unit PerfMon
The PerfMon event set available from the M2IOSF units does not give information about Intel® DDIO caching because they have no visibility into the LLC behavior. However, M2IOSF events are needed to correlate Intel® DDIO behavior back to a specific M2IOSF unit and PCI Express bifurcation (part). Recall that CHA events give socket level resolution without information at the M2IOSF or individual I/O device granularity. There is no foolproof methodology for mapping Intel® DDIO LLC hits or misses back to an individual device when there are multiple I/O devices active. Still, the M2IOSF events give clues based on request rates and queuing.
3.2.1 IIO PerfMon Events
The IIO unit PerfMon event set provides per I/O device observability (up to x4 bifurcation granularity) and is the only point of observability in the system with this information. The neighboring IRP unit loses this per I/O device resolution. Likewise, it is also the only unit where we can measure bandwidth at a finer resolution than 64 bytes. The IIO unit can accurately report data movement in up to 4-byte increments, while all other units like IRP, CHA, and IMC provide cache-line granularity of 64 bytes.
The possible x4 bifurcations are represented in event names using “part numbers,” ranging from part0 to part7, supporting up to 8 x4 bifurcations per M2IOSF. Rather than iterating event names for all eight parts, the event table below uses “n” to cover all possible parts.
The following list details the most useful IIO events for correlating Intel® DDIO behavior back to I/O devices.
|
Event Name |
Description |
|---|---|
|
UNC_IIO_CLOCKTICKS |
Number of IIO clock cycles while the event is enabled. |
|
UNC_IIO_TXN_REQ_OF_CPU.MEM _WRITE.PART[0-7] |
Counts the number of write/posted transactions (TXN) requested of the CPU. These are inbound/upstream writes initiated by the I/O device writing to coherent memory. It does not count how much data is moved, which can be up to one cache line. |
|
UNC_IIO_TXN_REQ_OF_CPU.MEM _READ.PART[0-7] |
Counts the number of read/non-posted transactions (TXN) requested of the CPU. These are inbound/upstream reads initiated by the I/O device reading from coherent memory. It does not count how much data is moved, which can be up to one cache line. |
|
UNC_IIO_TXN_REQ_OF_CPU.CMPD .PART[0-7] |
Counts the number of completion transactions (TXN) sent to the CPU from I/O. These are inbound/upstream completions initiated by the I/O device in response to an outbound/downstream read request received from the CPU. It does not count how much data is moved, which can be up to one cache line. |
|
UNC_IIO_TXN_REQ_BY_CPU.MEM _WRITE.PART[0-7] |
Counts the number of write/posted transactions (TXN) requested of an I/O device. These are outbound/downstream writes initiated by the CPU writing to an I/O device. It does not count how much data is moved, which can be 4 to 64 bytes. |
|
UNC_IIO_TXN_REQ_BY_CPU.MEM _READ.PART[0-7] |
Counts the number of read/non-posted transactions (TXN) requested of I/O device. These are outbound/downstream reads initiated by the CPU reading from an I/O device. It does not count how much data is moved, which can be 4 to 64 bytes. |
|
UNC_IIO_DATA_REQ_OF_CPU.MEM _WRITE.PART[0-7] |
Counts the number of DWORD (4 byte) writes sent upstream from I/O into the CPU cache or memory. |
|
UNC_IIO_DATA_REQ_OF_CPU.MEM _READ.PART[0-7] |
Counts the number of DWORD (4 byte) reads from CPU cache or memory due to upstream read requests initiated by I/O. |
|
UNC_IIO_DATA_REQ_OF_CPU .CMPD.PART[0-7] |
Counts the number of DWORD (4 byte) completions from I/O due to downstream read requests initiated by the CPU. |
|
UNC_IIO_DATA_REQ_BY_CPU.MEM _WRITE.PART[0-7] |
Counts the number of DWORD (4 byte) writes sent downstream from CPU to I/O. |
Table 3: M2IOSF IIO Events
3.2.2 Metrics
The following metrics can be used to simplify PerfMon event counts into a more human readable result for analyzing per device request rate and bandwidth:
|
Metric Name |
Formula |
Description |
|---|---|---|
|
io_inbound_read_requests |
UNC_IIO_TXN_REQ_OF_CPU.MEM_READ.PART[0-7] / SECONDS |
Inbound read requests per second, issued by I/O device mapped to specified PART. |
|
io_inbound_read_bandwidth |
UNC_IIO_DATA_REQ_OF_CPU.MEM_READ.PART[0-7] * 4 / 1000000 / SECONDS |
Bandwidth (in MB/S) due to inbound read requests from I/O device mapped to specified PART. The bandwidth measured is outbound completions from CPU to device due to inbound read requests. |
|
io_inbound_write_requests |
UNC_IIO_TXN_REQ_OF_CPU.MEM_WRITE.PART[0-7] / SECONDS |
Inbound write requests per second, issued by I/O device mapped to specified PART. |
|
io_inbound_write_bandwidth |
UNC_IIO_DATA_REQ_OF_CPU.MEM_WRITE.PART[0-7] * 4 / 1000000 / SECONDS |
Bandwidth (in MB/S) due to inbound writes from I/O device mapped to specified PART. |
|
io_outbound_read_requests |
UNC_IIO_TXN_REQ_BY_CPU.MEM_READ.PART[0-7] / SECONDS |
Outbound read requests per second, issued to I/O device mapped to specified PART. |
|
io_outbound_read_bandwidth |
UNC_IIO_DATA_REQ_OF_CPU.CMPD.PART[0-7] * 4 /1000000 / SECONDS |
Bandwidth (in MB/S) due to outbound read requests to the I/O device mapped to specified PART. The bandwidth measured is inbound completions from CPU to device due to outbound read requests. |
|
io_outbound_write_requests |
UNC_IIO_TXN_REQ_BY_CPU.MEM_WRITE.PART[0-7] / SECONDS |
Outbound write requests per second, issued to I/O device mapped to specified PART. |
|
io_outbound_write_bandwidth |
UNC_IIO_DATA_REQ_BY_CPU.MEM_WRITE.PART[0-7] *4 /1000000 / SECONDS |
Bandwidth (in MB/S) due to outbound writes to the I/O device mapped to specified PART. |
Table 4: M2IOSF Requests and Bandwidth Metrics
3.3 IMC Unit PerfMon
Monitoring memory bandwidth can also help evaluate the effectiveness of Intel® DDIO caching since efficient Intel® DDIO use increases cache hits, reducing the need for memory accesses. Only two events are needed from the IMC PMU to watch for memory access: the DDR Column Address Strobe (CAS) read-write events.
3.3.1 IMC PerfMon Events
|
Event Name |
Description |
|---|---|
|
UNC_M_CAS_COUNT.RD |
All DRAM read CAS commands issued (including underfills that are required for partial writes) |
|
UNC_M_CAS_COUNT.WR |
All DRAM write CAS commands issued. |
Table 5: IMC CAS Read and Write
3.3.2 IMC PerfMon Metrics
|
Metric Name |
Formula |
Description |
|---|---|---|
|
memory_bandwidth_read |
UNC_M_CAS_COUNT.RD * 64 / 1000000 / SECONDS |
DDR memory read bandwidth (MB/sec) |
|
memory_bandwidth_write |
UNC_M_CAS_COUNT.WR * 64 / 1000000 / SECONDS |
DDR memory write bandwidth (MB/sec) |
|
memory_bandwidth_total |
(UNC_M_CAS_COUNT.RD + UNC_M_CAS_COUNT.WR) * 64 / 1000000 / SECONDS |
DDR memory total bandwidth (MB/sec) |
Table 6: Memory Bandwidth Metrics
3.4 PerfMon Event to I/O Flow Decoder
The following figure maps PerfMon events to inbound/upstream I/O flows:
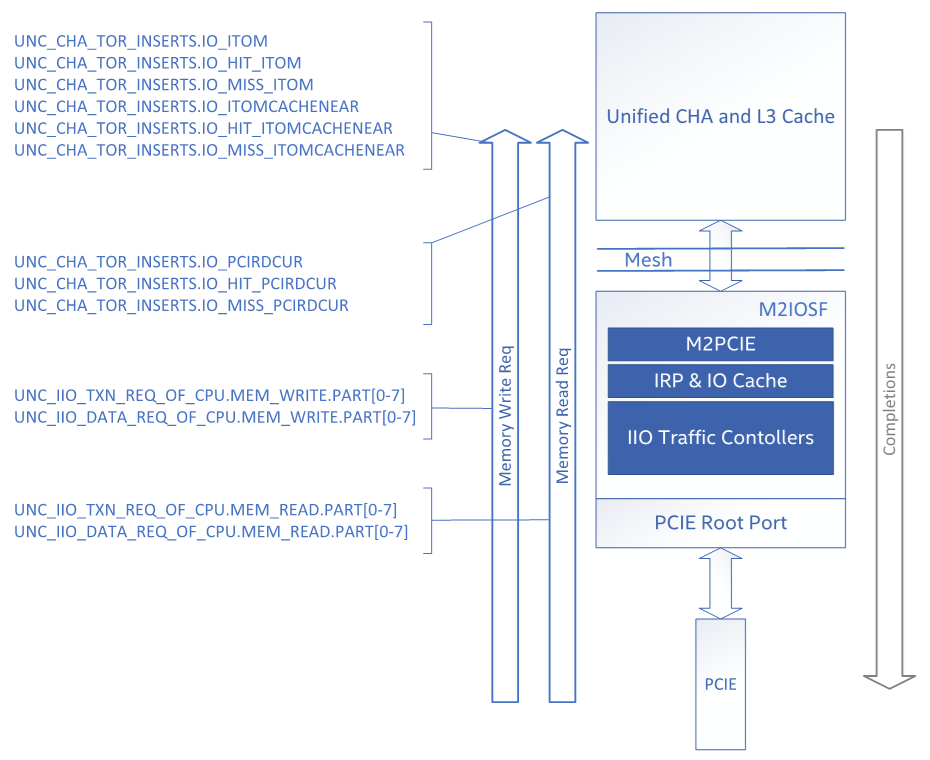
Figure 6: PerfMon Events for Inbound I/O Flows
Notice that for inbound read requests, the data is counted on the inbound side with “DATA_REQ_OF_CPU” events even though the data is flowing outbound/downstream in completion packets.
The following figure maps PerfMon events to outbound/downstream I/O flows:
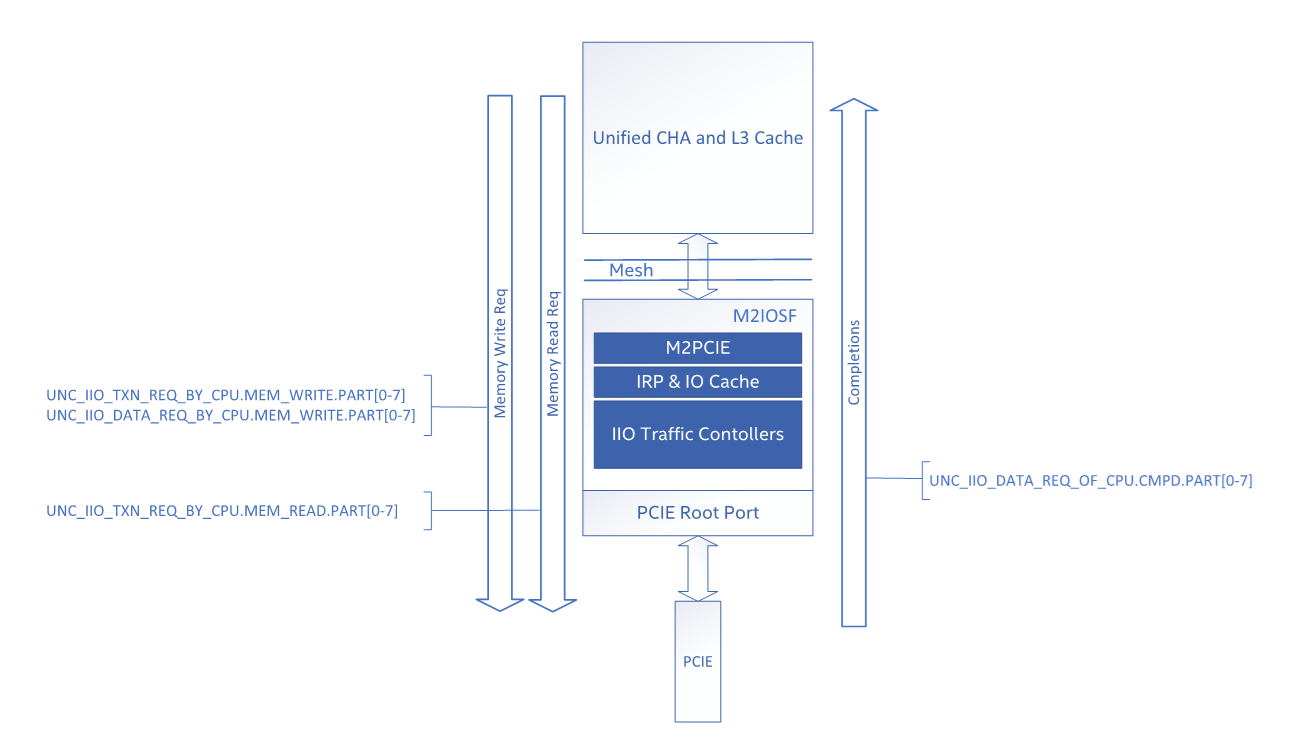
Figure 7: PerfMon Events for Outbound I/O Flows
Unlike inbound read requests, the outbound read data is counted on the completion data (CMPD) sent from I/O to the CPU with the UNC_IIO_DATA_REQ_OF_CPU.CMPD event.
4 Workload Optimizations to Improve Intel® DDIO Efficiency
- Reuse of memory addresses. By reusing memory addresses for I/O traffic buffers, you can help ensure that the data remains in the cache for as long as possible. This can reduce the need for costly memory accesses. In real-world applications, this is often accomplished by pre-allocating a sufficiently large number of memory buffers to store incoming I/O data.
- Improving temporal locality. Temporal locality refers to the practice of repeatedly accessing a specific memory location within a short time period. By improving the temporal locality of the reused buffers, you can increase the chances that a required piece of data is still in the cache when needed again, reducing the need to access main memory. Expanding on the previous example, storing data buffers in a stack structure instead of a FIFO or a linked list would improve the temporal locality of the data.
- Improving the time to use the inbound data. This involves processing the incoming data as quickly as possible. The faster the data is processed, the less time it spends in the cache, making room for new incoming data. Techniques to achieve this could include batch processing, parallel processing, and efficient queue management.
- Reducing the working set of the application. The working set of an application is the set of pages in system memory that are currently in use. Reducing the working of the application set can help ensure that a higher percentage of accesses are cache hits. For example, if an application uses circular buffers to manage I/O traffic one could experiment with reducing the size of the buffers.
- Increasing I/O LLC ways. In Intel® Xeon® processors, I/O LLC ways are the LLC ways designated for Intel® DDIO to allocate new inbound write data in the event of an inbound write LLC miss. Increasing the I/O LLC ways effectively increases the LLC cache size that can be used by Intel® DDIO for inbound writes, potentially improving cache hit rates.
5 Analyzing Performance of an I/O Workload in Context of Intel® DDIO
5.1 Iperf Workload Overview
In the following section, we demonstrate how enhancing the effectiveness of Intel® DDIO can significantly improve the performance of an I/O workload on an Intel server. We utilize an iperf3 workload as a representative case study. Iperf3 is a widely used tool for measuring the performance of a computer network. It follows a client-server model where the client sends network traffic to the server. In our analysis, we run instances of iperf3 clients and iperf3 servers on the same server to generate bidirectional network traffic. Iperf3 relies on the kernel networking stack of the operating system to handle the sending and receiving of TCP packets. The kernel networking stack manages network connections, packet routing, buffer management, and other low-level networking operations.
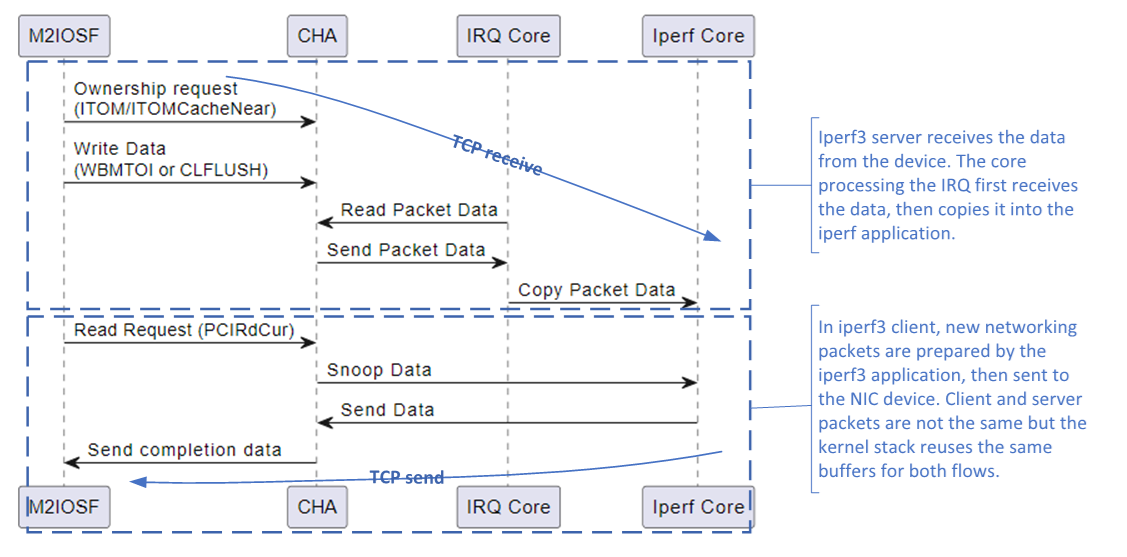
Figure 8: High-level Transaction Flow with Iperf Workload
5.2 Improving Intel® DDIO Efficiency in iperf3 Workload
|
Time interval for PMON metrics = 1 second |
Default |
Reduced 2048 queues |
Comment |
|---|---|---|---|
|
iperf3 Throughput, Gb/s |
600 |
701 |
As outlined in the prior section, the effectiveness of DDIO can be enhanced by reducing the application's working set, an effect achieved by decreasing the device queue size. In our workload configuration with a total of 48 queues, reducing queue size from 8k entries to 2k entries aids in decreasing the working set by a minimum of 6k*42*32B=9.28MB. This singular configuration change results in a performance improvement of the workload by 16% |
|
io_inbound_read_bandwidth |
40,130 |
46,912 |
The inbound write and read bandwidth metrics reflect the increase in workload throughput. We see roughly equal read and write bandwidth as our iperf3 workload is configured as both client and server simultaneously. |
|
io_inbound_write_bandwidth |
39,575 |
44,614 |
|
|
UNC_IIO_DATA_REQ_OF _CPU.MEM_READ.PART0 |
10,032,541,573 |
11,728,043,894 |
|
|
UNC_IIO_DATA_REQ_OF _CPU.MEM_WRITE.PART0 |
9,893,723,055 |
11,153,407,851 |
|
|
UNC_CHA_TOR_INSERTS.IO _CLFLUSH |
- |
- |
|
|
UNC_CHA_TOR_INSERTS.IO _ITOM |
615,958,610 |
695,004,460 |
Decreasing the ring sizes helps reduce the inbound I/O write miss rate, allowing the CPU cores to quickly fetch the data from the LLC. |
|
UNC_CHA_TOR_INSERTS.IO _HIT_ITOM |
96,847,962 |
356,015,603 |
|
|
UNC_CHA_TOR_INSERTS.IO _MISS_ITOM |
524,548,564 |
347,039,047 |
|
|
io_percent_of_inbound_full_writes _that_miss_l3 |
85% |
50% |
|
|
UNC_CHA_TOR_INSERTS.IO _ITOMCACHENEAR |
248 |
40 |
In this workload configuration, the device is not generating any partial inbound I/O writes. |
|
UNC_CHA_TOR_INSERTS.IO _HIT_ITOMCACHENEAR |
753 |
8,516 |
|
|
UNC_CHA_TOR_INSERTS.IO _MISS_ITOMCACHENEAR |
218 |
644 |
|
|
UNC_CHA_TOR_INSERTS.IO _PCIRDCUR |
653,237,920 |
763,394,767 |
Decreasing the ring sizes also contributes to a reduction in the inbound I/O read miss rate, albeit to a lesser extent. |
|
UNC_CHA_TOR_INSERTS.IO _HIT_PCIRDCUR |
127,544,461 |
255,145,459 |
|
|
UNC_CHA_TOR_INSERTS.IO _MISS_PCIRDCUR |
576,559,227 |
563,896,953 |
|
|
io_percent_of_inbound_full_reads_that _miss_l3 |
88% |
74% |
|
|
UNC_CHA_TOR_INSERTS.IO _WBMTOI |
547,825,798 |
657,470,490 |
|
|
L2 Miss Latency, ns |
121 |
82 |
The primary benefit of enhancing DDIO efficiency is a decrease in read latency experienced by the application. This, in turn, leads to an improvement in workload performance. |
|
metric_memory bandwidth read (MB/sec) |
93,299 |
74,584 |
Another beneficial side effect of utilizing DDIO effectively is the decrease in system memory demand. |
|
metric_memory bandwidth write (MB/sec) |
46,560 |
35,209 |
|
|
metric_memory bandwidth total (MB/sec) |
139,437 |
107,462 |
Table 7: Performance Analysis of iperf Workload with Reduced Device Queue Sizes Using Intel PMON Metrics.
5.3 Performance Implications of Disabling Allocating Inbound Writes
Disabling allocating Intel® DDIO inbound write flows significantly impacts the performance of the iperf3 workload. In this configuration, packet data is written directly to memory rather than cached in the Last Level Cache (LLC). In the iperf workload, the network packets are copied by the core; with non-allocating flows, this operation becomes more expensive as the cores now must read the data from memory instead of LLC. In addition to the latency impact, disabling allocating writes increases the demand for system memory. Consequently, we've observed a 16% performance degradation compared to when allocating Intel® DDIO inbound write flows are enabled.
|
Time interval for PMON metrics = 1 second |
2048 queues |
non-allocating + 2048 queues |
Comment |
|---|---|---|---|
|
iperf3 Throughput, Gb/s |
701 |
605 |
The benefits of DDIO to the iperf3 workload can also be indirectly confirmed by switching to non-allocating inbound I/O write flows. In this configuration, packet data is written to memory rather than being cached in the LLC. In this case, we observe a 16% performance degradation from our previous example. |
|
io_inbound_read_bandwidth |
46,912 |
42,063 |
As in the previous example, inbound read and write bandwidth metrics closely correlate with the workload throughput (in bytes instead of bits) |
|
io_inbound_write_bandwidth |
44,614 |
36,336 |
|
|
UNC_IIO_DATA_REQ_OF_CPU .MEM_READ.PART0 |
11,728,043,894 |
10,515,872,956 |
|
|
UNC_IIO_DATA_REQ_OF_CPU .MEM_WRITE.PART0 |
11,153,407,851 |
9,084,104,796 |
|
|
UNC_CHA_TOR_INSERTS.IO _CLFLUSH |
- |
570,128,486 |
Non-allocating flows end the write flow with a WBMTOI operation instead of a CLFLUSH operation. This change directs inbound write data to system memory rather than the LLC. |
|
UNC_CHA_TOR_INSERTS.IO _WBMTOI |
657,470,490 |
218 |
|
|
L2 Miss Latency, ns |
82 |
133 |
When allocating inbound write flow is disabled, the core fetches the packet data from memory instead of LLC. This results in an increase in read latency. |
|
metric_memory bandwidth read (MB/sec) |
74,584 |
76,602 |
Additionally, disabling allocating flows results in increased utilization of write memory bandwidth. |
|
metric_memory bandwidth write (MB/sec) |
35,209 |
44,930 |
|
|
metric_memory bandwidth total (MB/sec) |
107,462 |
121,531 |
Table 8: Performance Analysis of iperf Workload with Allocating and Non-Allocating Inbound IO Writes Using Intel PMON Metrics.
6 Tools
6.1 Intel® VTune™ Profiler
The Intel® VTune™ Profiler is a performance monitoring tool that supports Windows and Linux Operating Systems and has built-in analytics to help abstract the raw performance monitoring event details to a metric level. VTune™ can be obtained at the Intel® VTune™ Profiler website [4].
Information on the Intel® DDIO analysis offered by VTune™ is documented in the Intel® VTune™ Profiler Performance Analysis Cookbook article “Effective Utilization of Intel® Data Direct I/O Technology”[5].
6.2 Linux Perf
Linux perf is a well-known and powerful tool for performance analysis. Support for IO performance metrics has been added to Linux perf and can be accessed using the perf metrics flag, as shown below. The PMON events used to calculate the metric are also displayed.
$ perf stat -M io_bandwidth_write -a sleep 1

$ perf stat -M io_bandwidth_read -a sleep 1

6.3 Intel® Performance Counter Monitor (PCM)
Intel Performance Counter Monitor (PCM) is a powerful toolset that provides detailed insight into the internal workings of Intel processors, aiding in optimizing software performance. For an overview of PCM, see “Intel® Performance Counter Monitor - A Better Way to Measure CPU Utilization” [6].
One of its key components is the PCM-PCIe tool, specifically designed to monitor Direct Data I/O (DDIO) transactions. The tool can track both upstream and downstream reads and writes, providing a comprehensive view of data flow within the system. Furthermore, PCM-PCIe can show Last Level Cache (LLC) hits and misses for upstream transactions.

PCM-IIO tool offers similar capabilities in monitoring upstream and downstream transactions but adds an extra layer of granularity by providing a breakdown per PCIe bus. Unlike PCM-PCIe, which provides aggregate data, PCM-IIO can isolate and display information for individual PCIe buses. This feature is particularly useful for systems with multiple PCIe devices, as it allows for a more detailed analysis and understanding of each device's performance and data transactions.

Using the PCM-PCIe and PCM-IIO tools, developers and system administrators can gain a deeper understanding of system performance and make informed decisions to improve efficiency and throughput.
7 Conclusion
Intel® Data Direct I/O Technology transparently provides I/O devices with the ability to directly access the last level cache, which can drastically increase performance due to lower latencies, CPU utilization, and higher bandwidth. While this feature is transparent to the operating system, IO devices, and I/O device drivers, observing the efficiency of Intel® DDIO with performance monitoring to further optimize an I/O flow to increase LLC hit rates can be beneficial. Such optimization may include:
- reuse of memory addresses
- improving temporal locality
- improving time to use of the inbound data
- reducing the working set of an application
- increasing the number of I/O LLC ways.
8 Notices and Disclaimers
Performance varies by use, configuration, and other factors. Learn more at www.Intel.com/PerformanceIndex
Performance results are based on testing as of the dates shown in configurations and may not reflect all publicly available updates. See the appendix for configuration details. No product or component can be absolutely secure.
Code names are used by Intel to identify products, technologies, or services that are in development and not publicly available. These are not "commercial" names and not intended to function as trademarks.
Copies of documents which have an order number and are referenced in this document may be obtained by calling 1-800-548-4725 or visiting www.intel.com/design/literature.htm .
Intel, the Intel logo, VTune and Xeon are trademarks of Intel Corporation in the U.S. and other countries.
9 References
[2] “Intel® Performance Monitoring GitHub Repository,” [Online]. Available
[3] “Sapphire Rapids Server Uncore Performance Monitoring Event List,” [Online]. Available
[4] “Intel® VTune™ Profiler,” [Online]. Available
Appendix
|
Date |
12/15/2023 |
|---|---|
|
System |
Supermicro SYS-741GE-TNRT |
|
Baseboard |
Supermicro X13DEG-QT |
|
Chassis |
Supermicro Other |
|
CPU Model |
INTEL(R) XEON(R) PLATINUM 8592+ |
|
Microarchitecture |
EMR_XCC |
|
Sockets |
2 |
|
Cores per Socket |
64 |
|
Hyperthreading |
Enabled |
|
CPUs |
256 |
|
Intel Turbo Boost |
Enabled |
|
Base Frequency |
1.9GHz |
|
All-core Maximum Frequency |
2.9GHz |
|
Maximum Frequency |
1.9GHz |
|
NUMA Nodes |
4 |
|
Installed Memory |
512GB (16x32GB DDR5 4800 MT/s [4800 MT/s]) |
|
Hugepagesize |
2048 kB |
|
Transparent Huge Pages |
madvise |
|
Automatic NUMA Balancing |
Disabled |
|
NIC |
2x MT2910 Family [ConnectX-7] |
|
Disk |
1x 223.6G INTEL SSDSC2KB240G8, 1x 240M UDisk |
|
BIOS |
2 |
|
Microcode |
0x21000161 |
|
OS |
Ubuntu 22.04 LTS |
|
Kernel |
5.15.0-27-generic |
|
TDP |
350 watts |
|
Power & Perf Policy |
Normal (6) |
Table 9: System Configuration for the IPerf DDIO Example