Contributors (in historical order)
Roman Dementiev, Thomas Willhalm, Otto Bruggeman, Patrick Fay, Patrick Ungerer, Austen Ott, Patrick Lu, James Harris, Phil Kerly, Patrick Konsor,Andrey Semin, Michael Kanaly, Ryan Brazones, Rahul Shah, Jacob Dobkins
Introduction to Intel® PCM (Performance Counter Monitor)
The complexity of computing systems has tremendously increased over the last decades. Hierarchical cache subsystems, non-uniform memory, simultaneous multithreading and out-of-order execution have a huge impact on the performance and compute capacity of modern processors.
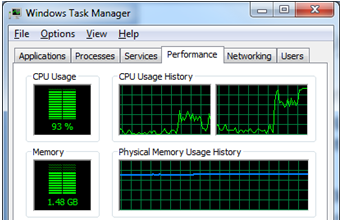
Figure 1: "CPU Utilization" measures only the time a thread is scheduled on a core
Software that understands and dynamically adjusts to resource utilization of modern processors has performance and power advantages. The Intel® Performance Counter Monitor provides sample C++ routines and utilities to estimate the internal resource utilization of the latest Intel® Xeon® and Core™ processors and gain a significant performance boost
When the CPU utilization does not tell you the utilization of the CPU
CPU utilization number obtained from operating system (OS) is a metric that has been used for many purposes like product sizing, compute capacity planning, job scheduling, and so on. The current implementation of this metric (the number that the UNIX* "top" utility and the Windows* task manager report) shows the portion of time slots that the CPU scheduler in the OS could assign to execution of running programs or the OS itself; the rest of the time is idle. For compute-bound workloads, the CPU utilization metric calculated this way predicted the remaining CPU capacity very well for architectures of 80ies that had much more uniform and predictable performance compared to modern systems. The advances in computer architecture made this algorithm an unreliable metric because of introduction of multi core and multi CPU systems, multi-level caches, non-uniform memory, simultaneous multithreading (SMT), pipelining, out-of-order execution, etc.
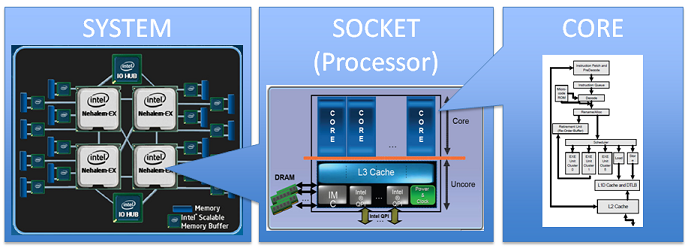
Figure 2: The complexity of a modern multi-processor, multi-core system
A prominent example is the non-linear CPU utilization on processors with Intel® Hyper-Threading Technology (Intel® HT Technology). Intel® HT technology is a great performance feature that can boost performance by up to 30%. However, HT-unaware end users get easily confused by the reported CPU utilization: Consider an application that runs a single thread on each physical core. Then, the reported CPU utilization is 50% even though the application can use up to 70%-100% of the execution units. Details are explained in [1].
A different example is the CPU utilization for "memory throughput"-intensive workloads on multi-core systems. The bandwidth test "stream" already saturates the capacity of memory controller with fewer threads than there are cores available.
Abstraction Level for Performance Monitoring Units
The good news is that Intel processors already provide the capability to monitor performance events inside processors. In order to obtain a more precise picture of CPU resource utilization we rely on the dynamic data obtained from the so-called performance monitoring units (PMU) implemented in Intel's processors. We concentrate on the advanced feature set available in the current Intel® Xeon® 5500, 5600, 7500, E5, E7 and Core i7 processor series [2-4].
We have implemented a basic set of routines with a high level interface that are callable from user C++ application and provide various CPU performance metrics in real-time. In contrast to other existing frameworks like PAPI* and Linux* "perf" we support not only core but also uncore PMUs of Intel processors (including the recent Intel® Xeon® E7 processor series). The uncore is the part of the processor that contains the integrated memory controller and the Intel® QuickPath Interconnect to the other processors and the I/O hub. In total, the following metrics are supported:
- Core: instructions retired, elapsed core clock ticks, core frequency including Intel® Turbo boost technology, L2 cache hits and misses, L3 cache misses and hits (including or excluding snoops).
- Uncore: read bytes from memory controller(s), bytes written to memory controller(s), data traffic transferred by the Intel® QuickPath Interconnect links.
Intel® PCM version 1.5 (and later) also supports Intel® Atom™ processors but counters like memory and Intel® QPI bandwidth and L3 Cache Misses will always show 0 because there is no L3 Cache in the Intel® Atom™ processor and no on-die memory controller or Intel® QPI links.
Intel® PCM version 1.6 supports on-core performance metrics (like instructions per clock cycle, L3 cache misses) of 2nd generation Intel® Core™ processor family (Intel® microarchitecture code name Sandy Bridge) and an experimental support of some earlier Intel® microarchitectures (e.g. Penryn): it can be enabled by defining PCM_TEST_FALLBACK_TO_ATOM in the cpucounter.cpp.
I want to see these counters!
As an additional goody, the package includes easy-to-use command line and graphical utilities that are based on these routines. They can be used out-of-the box by users which cannot or do not want to integrate the routines in their code but are willing to monitor and understand the CPU capacity limits in real-time.
Figure 3 shows the screen shot of the command line utility on the Windows* platform. Whereas the Linux* version can rely on the MSR kernel module that is provided with the Linux kernel, no such facility is available on Windows. For Windows, a sample implementation of a Windows driver provides a similar interface.
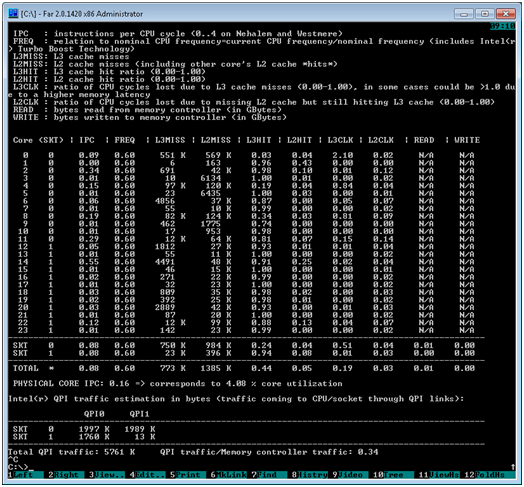
Figure 3: Intel® Performance Counter Monitor command line version
But there is more to come. For the Linux operating system, the package includes an adaptor that plugs into the KDE* utility ksysguard. Using this daemon, it is possible to graph the various metrics in real-time. Figure 4 shows a screen shot where some of the metrics are displayed during a workload run.
See figures 9 and 10 below for PCM version 2.0 versions of these screenshots.
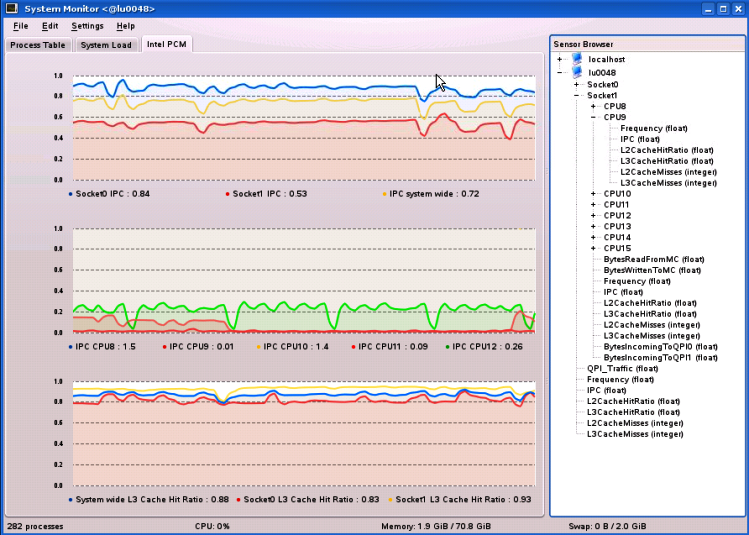
Figure 4: The KDE utility ksysguard on Linux can graph performance counters using a plug-in (from PCM v1.7)
Since these utilities provide a direct insight into the system, they can even be used to quickly find and understand fundamental performance bottlenecks in real-time. (In contrast to the Intel® VTune™ Performance Analyzer, they won't however tell you what parts of the application are causing the performance issue.)
Since version 1.5 the Intel® Performance Counter Monitor package contains a Windows* service, based on Microsoft .Net* 2.0 or better, that will create performance counters that can be shown in the Perfmon program that is delivered with the Microsoft Windows* OS. Microsoft's perfmon is capable of showing many useful performance counters on the Windows* OS like disk activity, memory usage, cpu load. More information about perfmon for Windows* 7 and Windows* 2008/R2 can be found at here (but perfmon has been available for many releases of Windows now). Please read the Windows_howto.rtf file on how to install and remove the service for Intel® PCM.
For all of the above mentioned hardware counters on the Nehalem and Westmere based platforms, a corresponding perfmon counter is created and therefore all features supported by perfmon are also available for these counters like logging over time in a file or database. For Intel Atom® processors the perfmon counters for memory and Intel® QPI bandwidth and L3 Cache Misses will always show 0 for reasons mentioned above. In a future update of Intel® Performance Counter Monitor the service will only show the available counters.
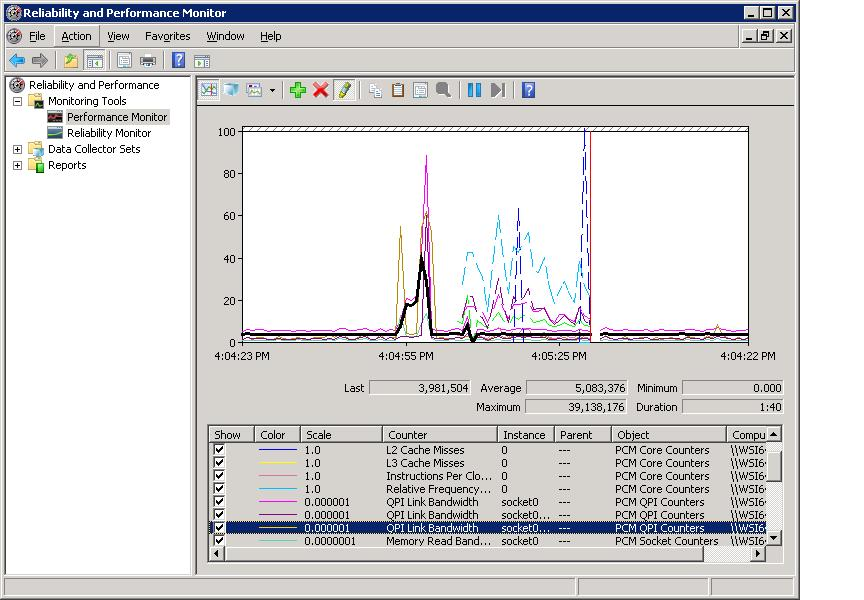
Figure 5: Windows* Perfmon showing data from Intel® Performance Counter Monitor v1.7
Intel® Performance Counter Monitor inside your programs
Thanks to the abstraction layer that the library provides, it has become very easy to monitor the processor metrics inside your application. Before their usage, the performance counters need to be initialized. Afterwards, the counter state can be captured before and after the code section of interest. Different routines capture the counters for cores, sockets, or the complete system, and store their state in corresponding data structures. Additional routines provide the possibility to compute the metric based on these states. The following code snippet shows an example for their usage:
PCM * m = PCM::getInstance();

// program counters, and on a failure just exit

if (m->program() != PCM::Success) return;

SystemCounterState before_sstate = getSystemCounterState();

     [run your code here]

SystemCounterState after_sstate = getSystemCounterState();

  cout << "Instructions per clock:" << getIPC(before_sstate,after_sstate)

  << "L3 cache hit ratio:" << getL3CacheHitRatio(before_sstate,after_sstate)

  << "Bytes read:" << getBytesReadFromMC(before_sstate,after_sstate)

  << [and so on]...
"CPU resource"-aware scheduling
To assess the potential impact of having precise resource utilization, we have implemented a simple scheduler that executed 1000 compute intensive and 1000 memory-bandwidth intensive jobs in a single thread. The challenge was the existence of non-predictable background load on the system, a rather typical situation in modern multi component systems with many third party components. Figure 6 depicts a possible schedule for a scheduler that is unaware of the background activity.
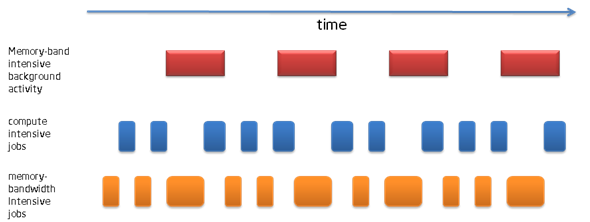
Figure 6: Scheduler without Intel® Performance Counter Monitor
If the scheduler can detect (using the provided routines) that a lot of the memory bandwidth is currently used by a different process, it can adjust its schedule accordingly. Our simulations show that such a scheduler executes the 2000 jobs 16% faster than a generic unaware scheduler on the test system.

Figure 7: Scheduler using Intel® Performance Counter Monitor
Intel PCM version 2.0 Features
Intel PCM version 2.0 adds support for the Intel® Xeon E5 series processor based on Intel microarchitecture codenamed Sandy Bridge EP/EN/E. This processor has a new uncore with lots of monitoring options.
For Intel® Xeon® E5 technical info see this page.
Below is a block diagram of the new processor from the Intel® Xeon® Processor E5-2600 Product Family Uncore Performance Monitoring Guide.
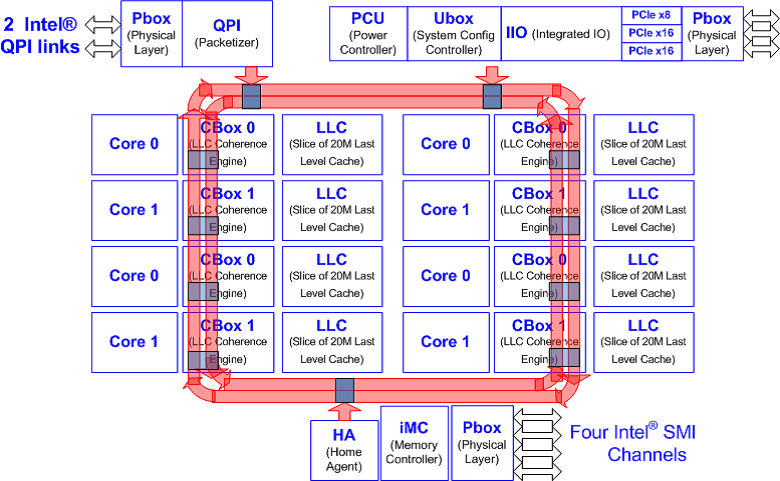
Figure 8: Intel® Xeon® E5 series block diagram
The Xeon E5 series processor's uncore has multiple 'boxes' similar to the Xeon E7 processor (Intel microarchitecture codename Westmere-EX). Intel PCM v2.0 supports Intel®QPI and memory metrics for the new processor.
Comparing the output of 'pcm.exe 1' version 1.7 versus version 2.0 on a Xeon E7 (Westmere-EX) based system, the primary differences are:
- Version 2.0 prints a 'TEMP' column for each core (and socket for Xeon E5 processor series) where 'TEMP' values are temperature reading in 1 degree Celsius relative to the TjMax temperature (thermal headroom): 0 corresponds to the max temperature
- Version 2.0 also displays the C-state core and package residency. This is the percentage of time that the core (or the whole package) spends in a particular level of C-state. The higher the level, the greater the power savings.
Intel® Xeon® E5 series specific features
The PCM version 2.0 information below applies to the Intel® Xeon® E5 series processor.
PCM version 2.0 adds more Intel® QPI info:
- the QPI link(s) speed
- the percentage of in-coming (received) QPI bandwidth used for data
- the bytes of out-going (transmitted) data and non-data traffic for each link along with percentage utilization for the out-going link.
Please, note that availability of Intel® QPI information may depend on support of Xeon E5 uncore performance monitoring units in your BIOS and the BIOS settings.
PCM version 2.0 also adds energy usage info:
- Energy usage by socket
- DRAM energy usage. If the BIOS doesn't support this feature then the DRAM energy will be reported as zero.
PCM-power utility
For the Intel® Xeon® E5 series processor, PCM version 2.0 also provides the pcm-power utility. The MSVS Windows project file for this utility is in the PCM-Power_Win directory.
The pcm-power utility displays, for all cases:
- For each socket and Intel® QPI port, the percentage of QPI clocks spent in the L0p and L1 lower power states. The L0p power saving state has half the QPI lanes are disabled. In L1 state all the lanes are in standby mode. The above mentioned uncore performance monitoring guide has more information on these metrics (see table 2-102). Please, note that availability of Intel® QPI information may depend on support of Xeon E5 uncore performance monitoring units in your BIOS and the BIOS settings.
- For each socket, display the energy used, the watts, and the thermal headroom.
- For the DRAM, display the energy and watts used, if the platform supports this feature. The value displayed will be zero if the DRAM energy display is not supported.
The pcm-power '-m' option displays IMC (Integrated Memory Controller) PMU (Performance Monitoring Unit) power state info. The valid options are:
- option '-m 0' displays DRAM rank 0 and rank 1 'CKE off' residencies
- 'CKE off' is a DRAM power saving state so the higher percentage of time you spend in 'CKE off' mode, then the less power the DRAM uses.
- Rank 0 and rank 1 are two of the ranks of the DRAM.
- This option is the default IMC PMU display if no other '-m' option is entered.
- option '-m 1' displays DRAM rank 2 and rank 3 'CKE off' residencies
- option '-m 2' displays DRAM rank 4 and rank 5 'CKE off' residencies
- option '-m 3' displays DRAM rank 6 and rank 7 'CKE off' residencies
- option '-m 4' displays DRAM self-refresh residencies
- 'self-refresh' mode is another DRAM power saving mode
- option '-m -1' omits IMC PMU output
- This is helpful to cut down on the output if you don't want DRAM info.
- This is helpful to cut down on the output if you don't want DRAM info.
The pcm-power '-p' option displays PCU (power control unit) PMU power state info. The valid options are:
- option '-p 0' displays frequency residencies
- This option uses the 'frequency banding' feature of the PCU PMU to display the percentage of time the cores spend in 3 'bands' of frequency.
- The default bands are 10, 20 and 40. You can override each band with '-a band0', '-b band1', and '-c band2'. Each band is multiplied by 100 MHz. The default bands then represent the %time the cores are in frequency:
- Band0: freq >= 1GHz
- Band1: freq >= 2GHz
- Band2: freq >= 4GHz
- This is the default -p option.
- On an idle system, running with './pcm-power.x "sleep 5" -p 0 -a 0 -b 12 -c 27' gave the output:
S0; PCUClocks: 3994206932; Freq band 0/1/2 cycles: 98.52%; 92.61%; 0.02%
Which means on Socket 0, for 3994206932 PCU clockticks, the processor spent:- 98.52% in band 0: freq >= 0 GHz,
- 92.61% in band 1: freq >= 1.2 GHz
- 0.02% in band 2: freq >= 2.7 GHz. The socket barely got into full nominal frequency (2.7 GHz) or turbo mode (2.8 GHz or higher)
- option '-p 1' displays core C-state residency
- The unit is the number of cores on the socket who were in C0, C3 or C6 during the measurement interval.
- On a busy system one can get:
S0; PCUClocks: 26512878934; core C0/C3/C6-state residency: 7.28; 0.00; 0.72
Which means that, for socket 0, during the interval, on average, 7.28 cores were in C0 (the full-power mode), 0.0 cores were in C3 (a low power state) and 0.72 cores were in C6 state (an even lower power state).
- option '-p 2' displays Prochot (throttled) residencies and thermal frequency limit cycles
- For instance, on a busy system one can get:
S0; PCUClocks: 50540355190; Internal prochot cycles: 0.00 %; External prochot cycles:0.00 %; Thermal freq limit cycles:0.00%
So the processor didn't hit any thermal throttling
- For instance, on a busy system one can get:
- option '-p 3' displays {Thermal,Power,Clipped} frequency limit cycles
- On a busy system one can get:
S0; PCUClocks: 26724849741; Thermal freq limit cycles: 0.00 %; Power freq limit cycles:2.36 %; Clipped freq limit cycles:89.63 %
So, for socket 0,- the freq was limited by thermal constraints 0.0% of the time. This is based on PCU event 0x4 FREQ_MAX_LIMIT_THERMAL_CYCLES.
- the power usage limited the freq 2.36% of the time. This is based on PCU event 0x5 FREQ_MAX_POWER_CYCLES.
- the current usage limited the freq 89.63% of the time. This is based on PCU event 0x7 FREQ_MAX_CURRENT_CYCLES.
- On a busy system one can get:
- option '-p 4' displays {OS,Power,Clipped} frequency limit cycles
- On a busy system one can get:
S0; PCUClocks: 26170529847; OS freq limit cycles: 6.09 %; Power freq limit cycles:2.39 %; Clipped freq limit cycles:91.51 %
So, for socket 0,- the freq was limited by the OS 6.09% of the time. This is based on PCU event 0x6 FREQ_MAX_OS_CYCLES.
- the power usage limited the freq 2.39% of the time. This is based on the same event as option '-p 3' second event.
- the current usage limited the freq 91.51% of the time. This is based on the same event as option '-p 3' third event.
- On a busy system one can get:
- option '-p -1' omits PCU PMU output
Updates to plugins for Linux Ksysguard and Windows* Perfmon GUI
In addition to the command line tools the graphical plugins for Linux Ksysguard and Windows* Perfmon have been extended with essential energy related metrics (C-states, thermal headroom, processor and DRAM energy).
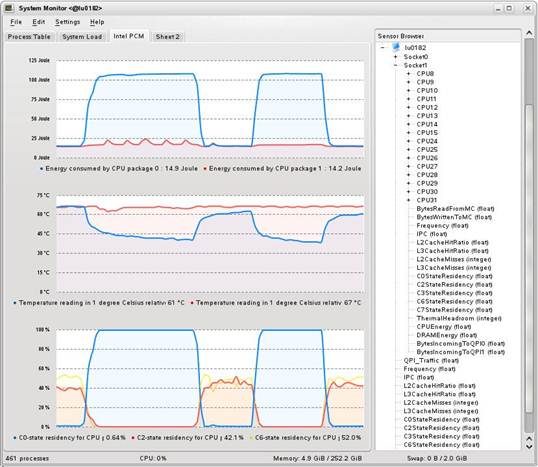
Figure 9: Intel PCM version 2.0 Ksysguard plugin showing energy metrics.

Figure 10: Intel PCM version 2.0 Windows* Perfmon plugin showing energy metrics.
Changelog
Version 1.0
- Initial release
Version 1.5
- Integration into Windows* perfmon
- Intel® Atom™ support
Version 1.6
- Intel® Xeon® E7 series support (Intel microarchitecture code name Westmere-EX)
- On-core performance metrics of 2nd generation Intel® Core™ processor family (Intel® microarchitecture code name Sandy Bridge)
- Highly experimental support of some earlier Intel® microarchitectures (e.g. Penryn). Enable by defining PCM_TEST_FALLBACK_TO_ATOM in the cpucounter.cpp
- Enhanced Linux KDE ksysguard plugin
- New options for the command line pcm utility
- Support of >64 cores on Windows 7 and Windows Server 2008 R2
- Support of Performance Monitoring Unit Sharing Guideline to prevent collisions with other processor performance monitoring agents (e.g. Intel® VTune™ Performance Analyzer)
Version 1.7
- Intel PCM is now distributed under BSD license. See license.txt file in zip.
- Support additional processor models with Intel® microarchitecture code name Nehalem
- New metrics: timestamps via RDTSCP instruction, C0 active core residency and a few other derived metrics
- Extended custom core configuration facility/mode
- Bug fixes
Version 2.0
- Support of Xeon E5 series (based on Intel microarchitecture code name Sandy Bridge EP/EN/E)
- CSV format output for the pcm command line utility (-csv option)
- Support of basic energy metrics (availability varies depending on processor architecture): core and package C states, processor and memory DRAM energy, temperature thermal headroom
- A new command line utility (pcm-power) for extended power and energy monitoring on Xeon E5 series (Intel microarchitecture code name Sandy Bridge EP/EN/E)
- Frequency residency (bands) statistics
- Processor and DRAM energy
- DRAM sleep CKE state statistics
- DRAM self-refresh statistics
- QPI power saving state statistics
- Core C-states statistics
- Frequency throttling cause statistics
- Experimental OpenGL 3D visualization tool for 2 Socket Xeon E5 series (Intel microarchitecture code name Sandy Bridge EP)
Version 2.1
- On-core performance metrics of 3nd generation Intel® Core™ processor family (Intel® microarchitecture code name Ivy Bridge)
Version 2.2
- Support of SGI UV 2 (up to 256 sockets)
- Support of uncore metrics for Intel microarchitecture code name Sandy Bridge E (single socket)
- Added frequency transition statistics for pcm-power tool
- Bug fixes
Version 2.3
- Support of Apple Mac OS X 10.7 ("Lion") and OS X 10.8 ("Mountain Lion")
- Support of FreeBSD
- new tool for monitoring memory traffic per channel on Intel Xeon processor E5 product family.
Version 2.3.5
- Experimental Linux perf driver support (see Makefile and LINUX_HOWTO.txt)
- Fixed cache metrics counting for Intel Xeon E5 based on Intel microarchitecture codenamed Sandy Bridge-EP and Sandy Bridge-E according to erratum
- Added core C1 residency metric
- Improved documentation and error messages
Version 2.4
- Support of memory bandwidth metrics on the 2nd, 3rd and 4th generation Intel® Core™ processors using integrated memory controller counters (Linux).
- Support of memory bandwidth metrics on additional server systems based on Intel® Xeon® E5 processors.
Version 2.5
- Support 4th generation Intel® Core™ processors (previously codenamed Haswell)
- New utility (pcm-tsx) for monitoring Intel® Transactional Synchronization Extensions (Intel® TSX) metrics (transactional success (total/transactional/aborted cycles) and custom TSX events)
- New utility (pcm-pcie) for monitoring PCIe traffic on Intel® Xeon® E5 processors
- Improved the speed of reading performance counters by factor up to 3x using new PCM::getAllCounterStates call
- Added Windows 2012 support
Version 2.5.1:
- Support of memory bandwidth metrics on the 2nd, 3rd and 4th generation Intel® Core™ processors using integrated memory controller counters (Apple OS X).
- Support on-core metrics for Intel® Atom™ Processor S1200 Series (previously codenamed Centerton)
- Bug fixes
Version 2.6:
- Support for Intel® Xeon® E5 v2 processor series (microarchitecture previously codenamed Ivybridge-EP)
- Support for Intel® Core™ i5-4350U (microarchitecture previously codenamed Haswell ULT)
- Support for Intel® Atom™ processor C2000 series (microarchitecture previously codenamed Avoton)
- Support for Intel® Atom™ processor Z3000 series (microarchitecture previously codenamed Baytrail)
- Support API for programming “off-core response” PMU events. A usage example is in the new pcm-numa utility.
- Bug fixes
Version 2.7:
- Support Intel® Xeon® E5 v3 processor series (previously codenamed Haswell-EP)
- Support scale-up systems with 16+ sockets based on Intel® Xeon® E7 v2 processor series
- Added I/O traffic metric for 2nd, 3rd and 4th generation Intel® Core™ processors
- Added package C-states, UFS and PPD cycles metrics to pcm-power
- Support DDIO hit/miss metric
- Support for individual QPI speeds
- Command line option improvements
- Support redirection of output to files
- Support user-level pause/resume of counting
- Support high-resolution sampling (min 1s -> a few ms)
- Add dynamic sampling interval selection
- CSV output for pcm-memory utility
- Support Linux systems with offlined cores
- Added PMU reset command line option
- Prevent metric value corruption by Linux NMI watchdog
- Support clang compilation
- Improved makefile
- Refactored code
- Bug fixes
Version 2.8
- Support Cache Monitoring Technology (CMT) implementing last level cache occupancy metric per logical core (visible in PCM tool)
- Added support for Intel® Core™ M processors
- Support of memory and I/O bandwidth metrics on the 2nd, 3rd and 4th generation Intel® Core™ processors and Intel® Core™ M processors using integrated memory controller counters (Windows)
- Fixed energy metrics for Intel® Xeon® E5 v3 processors
- Bug fixes
Version 2.9
- Support 5th generation Intel® Core™ processors (previously codenamed Broadwell)
- Support 6th generation Intel® Core™ processors (previously codenamed Skylake)
- Support Intel® Xeon® D - 1500 series processors (codename Broadwell-DE)
- Support Intel® Atom™ x7-Z8000 and x5-Z8000 series (codename CherryTrail and Braswell)
- A utility to query all available core performance counters (pmu-query.py) and a tool to monitor arbitrary core counters (pcm-core)
- Support systems with >256 logical cores on Windows
- Added DIMM (rank) traffic monitoring capability to pcm-memory
- Enhancements to pcm-memory and pcm output
- Bug fixes
Version 2.10
- Support Memory Bandwidth Monitoring technology (new local and remote memory bandwidth reported per (logical) core in pcm.x/exe)
- Added support of Broadwell-based Intel® Xeon® E3 series
- Added support of processor models based on architecture code-named Skylake U/Y.
- New option for pcm (-yescores to enable specific core output)
- Bug fixes
Version 2.11
- Support Intel® Xeon® E5 v4 processor family
- Support Memory Bandwidth Monitoring and Cache Monitoring Technologies in ksysguard plugin
- Support OS X 10.11.2 and XCode 7.2
- New usability enhancements and bug fixes
Version 2.11.1
- Bug fixes
Later versions of Intel PCM are now published directly on GitHub. Please see the release notes there for details.
References
For questions and comments about Intel PCM and its use-cases, we recommend the Software Tuning, Performance Optimization & Platform Monitoring forum.
[1] Drysdale, Gillespie, Valles "Performance Insights to Intel® Hyper-Threading Technology"
[2] Intel® 64 and IA-32 Architectures Software Developer's Manual, Volume 3B: System Programming Guide, Part 2
[3] Intel® Xeon® Processor 7500 Series Uncore Programming Guide
[4] Peggy Irelan and Shihjong Kuo "Performance Monitoring Unit Sharing Guide"
[5] David Levinthal "Performance Analysis Guide for Intel® Core™ i7 Processor and Intel® Xeon® 5500 processors"
Intel, Xeon, Core, and VTune are trademarks of Intel Corporation in the U.S. and other countries. *Other names and brands may be claimed as the property of others. Intel processor numbers are not a measure of performance. Processor numbers differentiate features within each processor family, not across different processor families. Go to: http://www.intel.com/products/processor_number
Any software source code reprinted in this document is furnished under a software license and may only be used or copied in accordance with the terms of that license. The software license text is included into the code sample.
Intel® Turbo Boost Technology requires a system with Intel® Turbo Boost Technology capability. Consult your PC manufacturer. Performance varies depending on hardware, software and system configuration. For more information, visit http://www.intel.com/technology/turboboost
Results have been estimated based on internal Intel analysis and are provided for informational purposes only. Any difference in system hardware or software design or configuration may affect actual performance.
This software is subject to the U.S. Export Administration Regulations and other U.S. law, and may not be exported or re-exported to certain countries (Burma, Cuba, Iran, North Korea, Sudan, and Syria) or to persons or entities prohibited from receiving U.S. exports (including Denied Parties, Specially Designated Nationals, and entities on the Bureau of Export Administration Entity List or involved with missile technology or nuclear, chemical or biological weapons).