This article describes the methods and tools we used to analyze the performance of ceph-osd. It summarizes the features of different tools, provides a brief analysis process, and sample results. Of course, these methods are also applicable to other applications.
Run Ceph
The process to run Ceph for performance analysis is shown in the example below. Crimson, which is a new ceph-osd for fast storage, is selected for analysis.
1. Build and run Ceph
$ git clone --recursive https://github.com/ceph/ceph.git
[ceph]$ WITH_SEASTAR=true ./install-deps.sh

[ceph]$ ./do_cmake.sh -DWITH_SEASTAR=ON -DWITH_MGR_DASHBOARD_FRONTEND=OFF -DWITH_CCACHE=ON -DWITH_TESTS=OFF

[build]$ ninja

[root@build]$ MGR=1 MON=1 OSD=1 MDS=0 RGW=0 ../src/vstart.sh \
-n -x --without-dashboard --nodaemon --redirect-output --nolockdep \
--crimson --seastore --seastore-devs /dev/xxx #block device
2. Create a pool and an image, then test with fio
[build]$ bin/ceph osd pool create _benchtest_ 128 128

[build]$ bin/ceph osd pool set --yes-i-really-mean-it _benchtest_ size 1 && bin/ceph osd pool --yes-i-really-mean-it set _benchtest_ min_size 1

[build]$ fio --ioengine=rbd --direct=1 --bs=4096 --iodepth=128  --end_fsync=0 --rw=randwrite --norandommap --size=16384M --numjobs=1 --runtime=600 --time_based --clientname=admin --pool=_benchtest_ --rbdname=fio_test --invalidate=0 --name=self-librbd
Perf
Perf is a generic profiler tool for Linux. It can perform function-level and instruction-level hotspot searches and can be used to analyze the CPU usage of hotspot functions in the program to locate performance bottlenecks. Perf offers a rich set of commands to collect and analyze performance and trace data.
Among them, perf record is often used to capture some data with call graphs. The perf record is driven by event-based sampling. The period is expressed as the number of occurrences of an event, not the number of timer ticks. The profiling data can be thousands of lines long and difficult to comprehend. Flame graphs are a visualization for sampled stack traces, which allows hot code-paths to be identified quickly.
Specific steps are shown below. The perf record command sampled at 99 Hz (-F 99), on our target PID, captured stack traces for call graph info. Then FlameGraph is called to generate graph results.
$ git clone https://github.com/brendangregg/FlameGraph

$ perf record -p `pidof ceph-osd` -F 99 --call-graph dwarf -- sleep 60

[FlameGraph]$ perf script | ./stackcollapse-perf.pl > out.perf-folded

[FlameGraph]$ ./flamegraph.pl out.perf-folded > perf.svg

[FlameGraph]$ firefox perf.svg
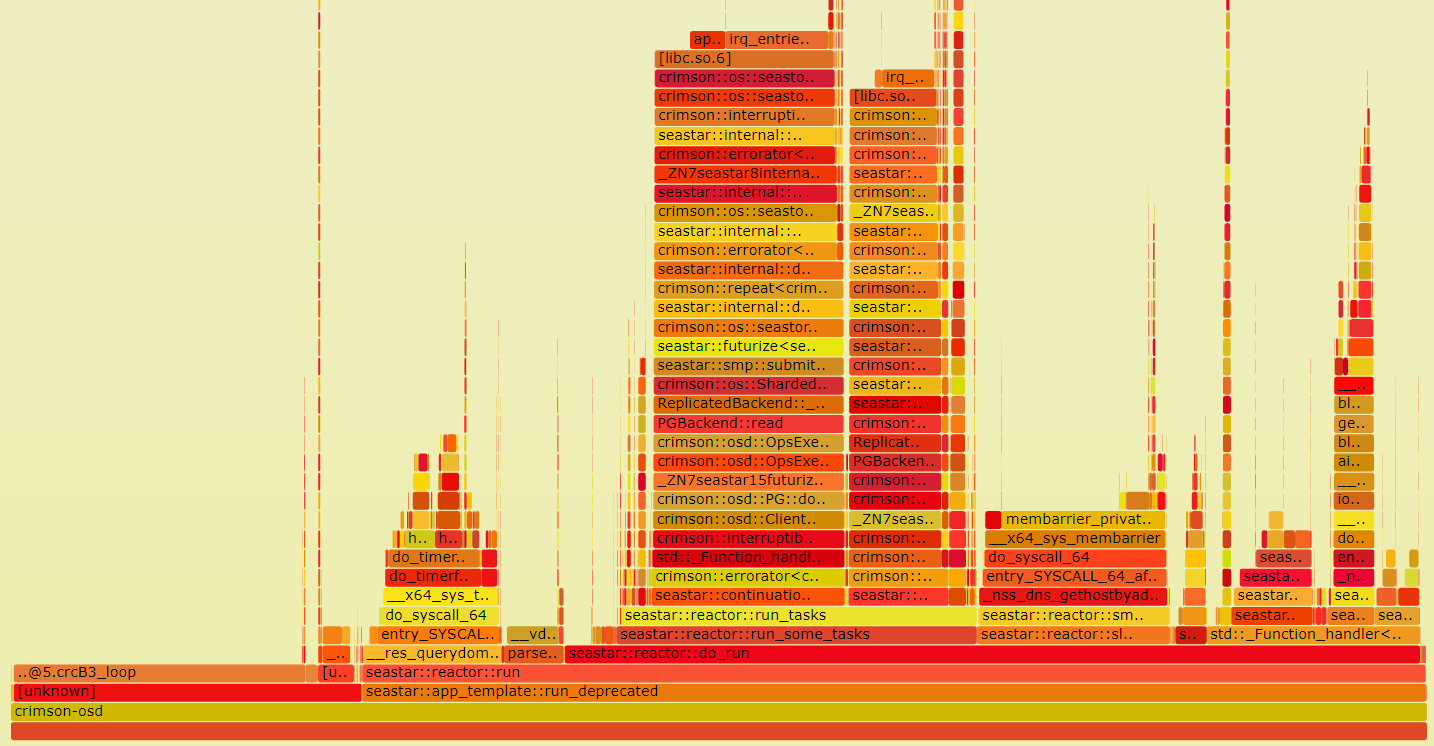
In the flame graph, each box represents a function in the call stack. The top box shows the function that was on-CPU. Everything beneath that is ancestry. The width of the box shows the total time it was on-CPU or part of an ancestry that was on-CPU. You could use the flame graph to see which function is the bottleneck.
We can see that in the sample graph crcB3_loop takes up a lot of CPU time. It is part of the calculation of CRC32. CRC32 is an error-detecting function that uses a CRC32 algorithm to detect changes between source and target data. In Ceph, this value is required when doing a replay after an unexpected power failure for cached extents. The extents need to maintain the value and recalculate it when content changes. This inspires us to optimize the calculation part of CRC32 to get better performance.
gProfiler
gProfiler is an open-source, continuous code, profiling tool developed by Granulate. gProfiler is designed to help developers and DevOps teams visualize their application’s execution sequences and resource usage down to the level of lines of code. This collects runtime data from a workload and presents this data in a user interface if the data is sent to the SaaS service.
gProfiler is very easy to use. First log into the site (https://profiler.granulate.io/login). In the Getting Started section of gProfiler, choose options for different deployment types such as Docker, Kubernetes, command line, and others.
After deployment, select the process and the time window to get a particular flame graph.

For a Ceph project, gProfiler’s value is reflected in the daily operation monitoring and data collection in production environment. Meanwhile, gProfiler collaborates with other products such as gCenter to implement real-time continuous optimization.
VTune™ Profiler
VTune Profiler is a performance profiling tool for C, C++, and Fortran code that can identify where in the code time is being spent in both serial and threaded applications. For threaded applications, it can also determine the amount of concurrency and identify bottlenecks created by synchronization primitives.
Compared to gProfiler, which uses ptrace to look at the pid (OS software level), VTune observes PMU events. That information goes into the next level, the hardware counter level and looks at different parts of the tmap stack.
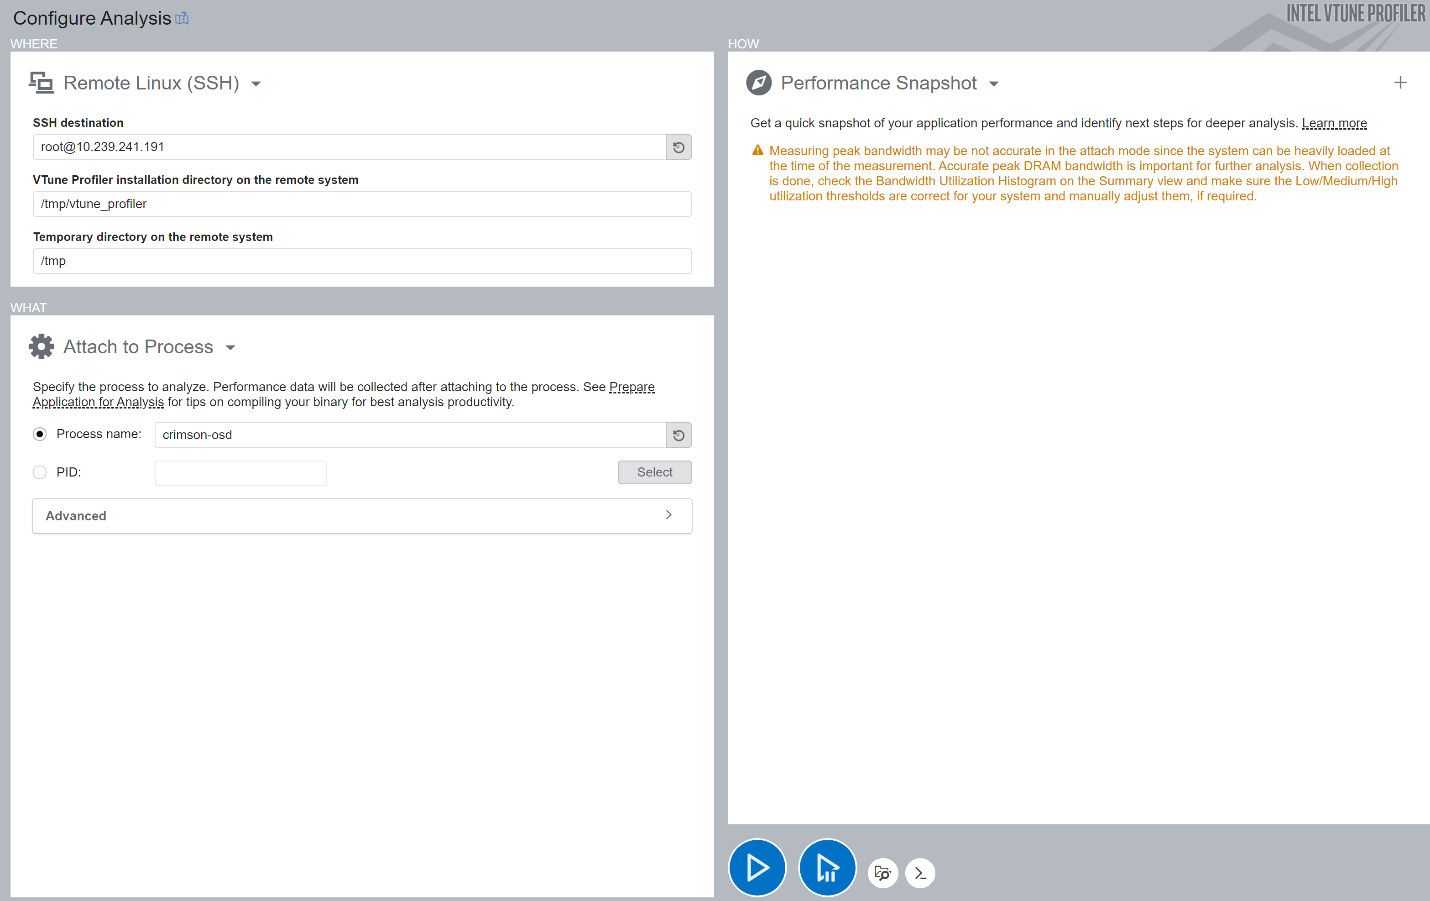
After installation, connect to the test environment, bind the osd process, and run analysis for some time.
This action provides a performance snapshot view that includes recommendations for other types of analysis you should consider next.
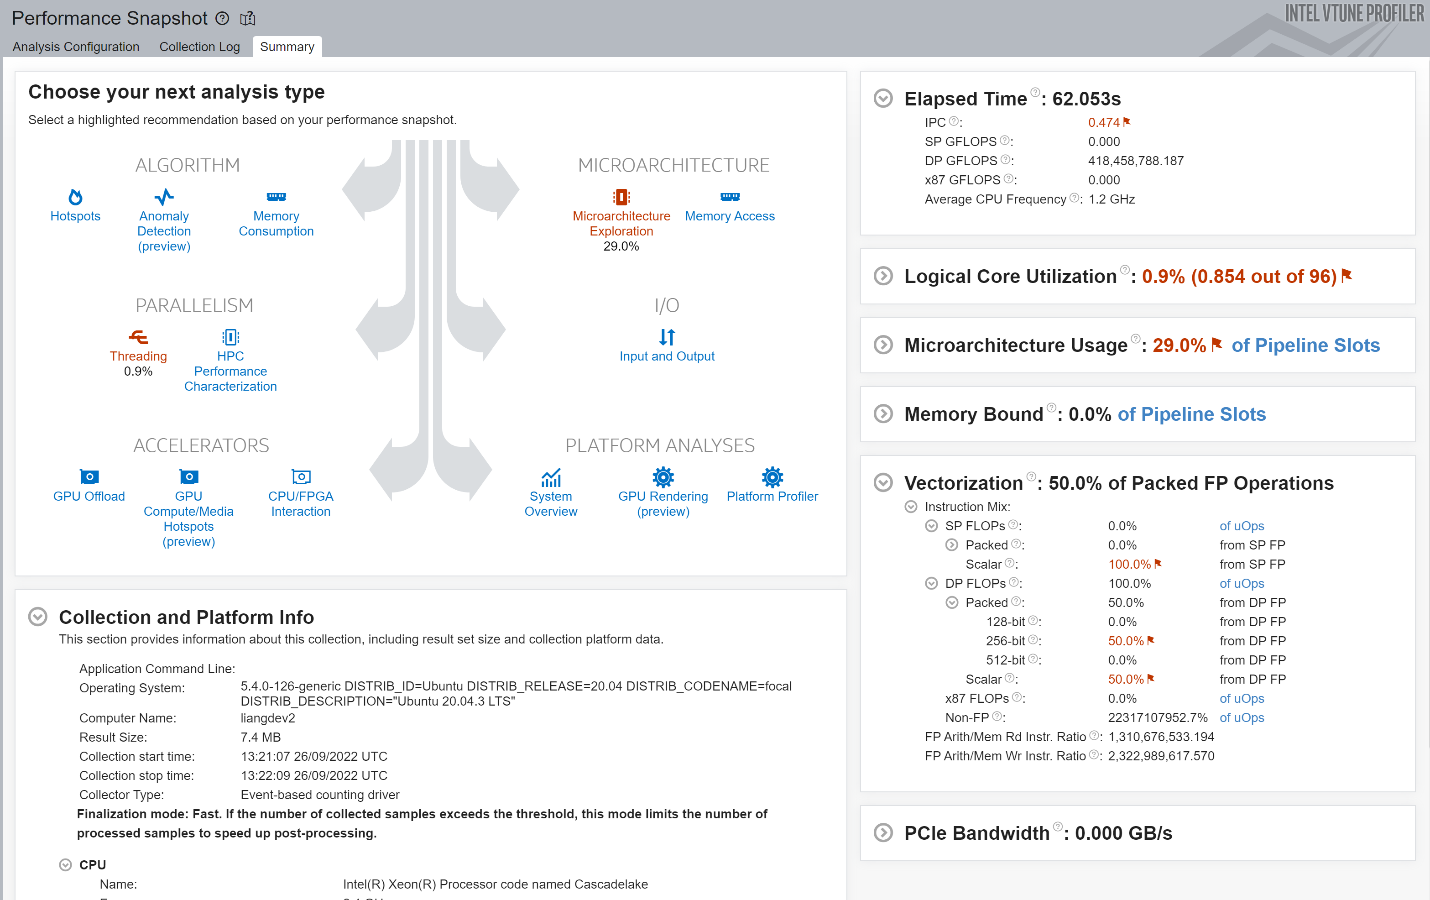
Select one in the Analysis Tree and do further information collection. Microarchitecture was chosen as an example. Use the Microarchitecture Exploration analysis to triage hardware usage issues in the application. For information on other types, go to the official guide.

The results provide an overview of application performance based on the top-down microarchitecture analysis method (TMA). Treat the diagram as a pipe with an output flow equal to the ratio of actual instructions retired/possible maximum instructions retired (pipe efficiency). If there are pipeline stalls decreasing retiring, the pipe shape gets narrow. Specific to this picture, crimson-osd is a front-end bound case, which means the application's bottleneck is the front-end portion of the pipelines. And the front-end latency metric is the main part. This metric reports cycles in which no low-level hardware operations were issued by the front-end in a cycle, while the back-end was ready to consume them. We can dig deeper into the specific metrics to modify them, such as instruction cache misses.
Summary
This article describes three methods to analyze the performance of Ceph.
Perf is the standard profiling infrastructure on Linux and is widely used. When we want to optimize a specific module or specific scenario of Ceph, Perf collects all function stack information. We can analyze the flame graph to identify performance bottlenecks, then investigate the specific code.
gProfiler is a lightweight application to monitor your process conveniently from the OS level. It is used in production environments to collect operating data for continuous optimization by other products. In other words, it is recommended to use after deploying Ceph cluster for production.
VTune Profiler is a profiling tool for visualization that has access to the PMU's and is very good with Intel-specific hardware. VTune is appropriate for algorithm optimization by locating hot spots as Perf does and for further tuning by identifying microarchitecture and memory bottlenecks. For example, it may catch memory-access-related issues in Ceph, such as cache misses.
References
- Ceph (https://ceph.io/en/)
- Crimson (https://docs.ceph.com/en/latest/dev/crimson/crimson/)
- Perf (https://perf.wiki.kernel.org/index.php/Main_Page)
- gProfiler (https://docs.gprofiler.io/)
- VTune (https://www.intel.com/content/www/us/en/developer/tools/oneapi/vtune-profiler.html)