Machine learning permeates all aspects of modern life. Various deep learning frameworks (TensorFlow*, PyTorch*, Keras*) serve as basic building blocks that are used by developers to build AI applications that solve a breadth of real-world problems ranging from cybersecurity and retail to quality assurance and medical diagnostics. Given the growth in size, scope, and compute requirements of AI applications, there is an increased need to continuously optimize their performance through the use of profiling and analysis tools.
Understanding the computational and memory bottlenecks in machine learning code bases (Python*, C++) is not easy and often takes significant manual effort due to the large number of hierarchical layers and nonlinear functions involved. AI Frameworks, such as TensorFlow and PyTorch, provide native tools and APIs that allow the collection and analysis of performance metrics during different stages of machine learning model development. However, the scope of these profiling APIs and tools is limited, and they do not provide the deep hardware-level insight necessary for optimizing different operators and functions of these machine learning models.
This is where the Intel® VTune™ Profiler comes in—it provides advanced implementation-level and platform-level awareness, helping developers optimize application performance, system performance, and system configuration.
Not only that, Intel VTune Profiler also works great with Python and C++, making it a suitable candidate for profiling machine learning workloads that frequently use one or a mix of both programming languages in their implementation.
Profile with Intel® VTune™ Profiler
The Intel VTune Profiler optimizes application and system performance for AI, HPC, and IoT use cases. This article discusses three approaches provided by Intel VTune Profiler to analyze and optimize machine learning applications:
- Direct approach
- Using Instrumentation and Tracing Technology (ITT) for Python (Python with Intel VTune Profiler instrumentation and tracing technology)
- Using ITT APIs that specifically target the PyTorch framework
Code Example
This demo uses the TensorFlow_HelloWorld and Intel_Extension_For_PyTorch_Hello_World getting started examples located in the oneAPI samples repository on GitHub*. Both code samples are implementations of a simple neural network with one convolution layer, one normalization layer, and one rectified linear unit (ReLU) layer that can be quickly trained and evaluated.
System Configuration
- CPU: 11th gen Intel® Core™ i7-1165G7 processor at 2.80 GHz
- Operating System: Ubuntu* 20.04.5 LTS
Direct Approach
This is the simplest approach to profiling the machine learning application because it does not require any changes to the source code. Hot spot analysis is a good starting point for profiling a machine learning application and finding out the most time-consuming regions of your source code. To run a hot spot analysis on the example code, use the following command line:
vtune -collect hotspots -knob sampling-mode=sw -knob enable-stack-collection=true -source-search-dir=path_to_src -search-dir /usr/bin/python3 -result-dir vtune_hotspots_results -- python3 Intel_Extension_For_PyTorch_Hello_World.py
Here is a snapshot of the top hot spots when the Intel VTune Profiler hot spot analysis was run on Intel_Extension_For_PyTorch_Hello_World.py:
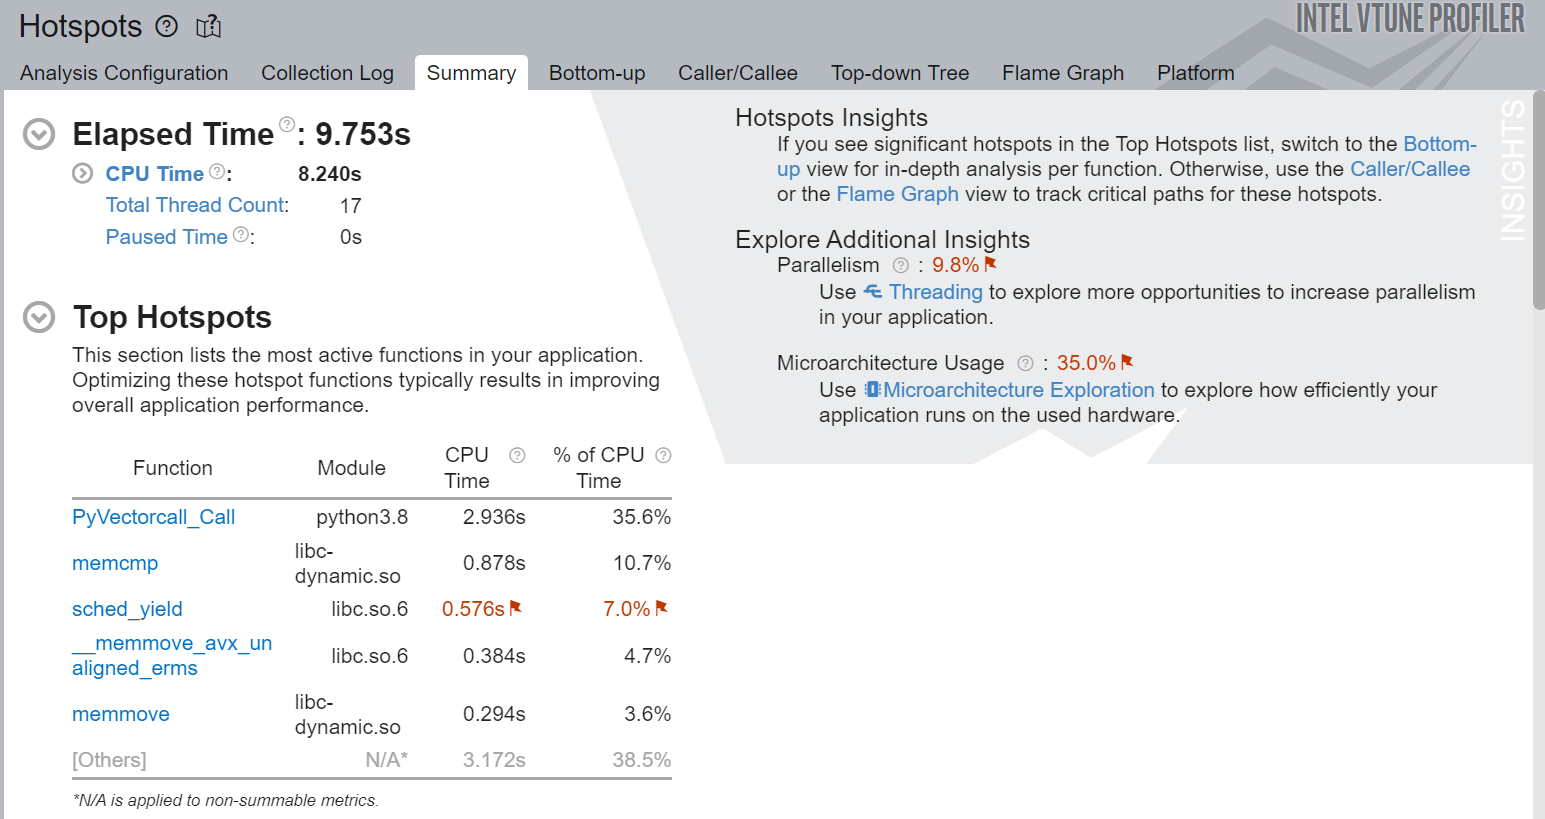
Figure 1. Summary view of Intel VTune Profiler hot spots analysis
This analysis shows the most active functions in the machine learning application:
- The Top Hotspots section in Figure 1 shows that the top four functions have been enlisted in the Top Hotspots section by Intel VTune Profiler.
- The sched_yield has been marked red, which means the application is spending more time in this function than it should and there are still some scopes of improvements.
- Excessive sched_yield calls degrade the application's performance by causing unnecessary context switches.
Here is a snapshot of the application's Top Tasks:
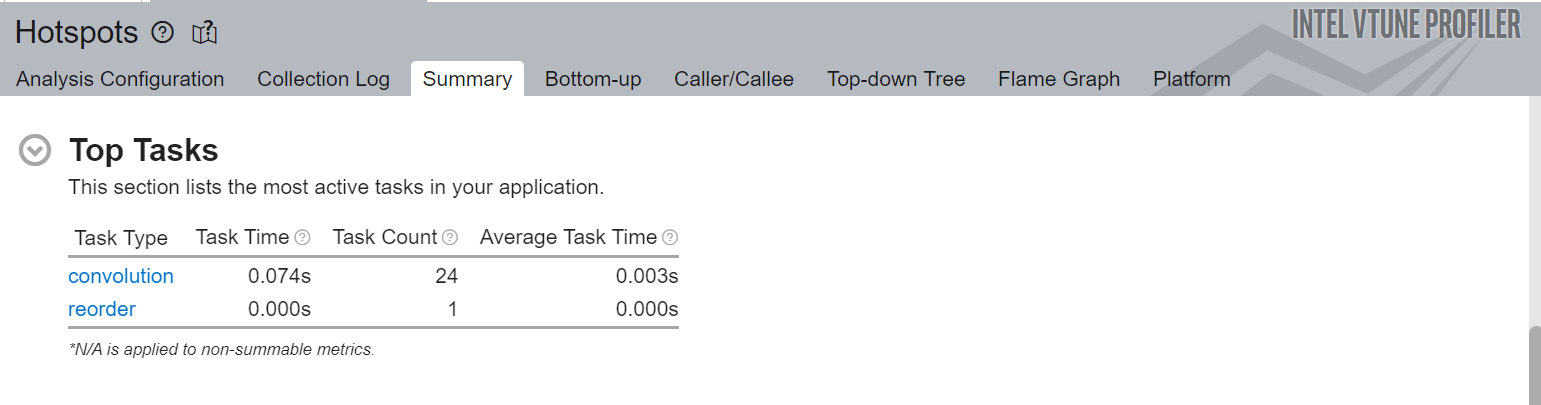
Figure 2. Summary view of the Top Tasks analysis in Intel VTune Profiler
As you can see from Figure 2, the convolution task is taking most of the time for this model. More information on this task can be found on the Bottom-up view of Hotspots.
However, from the results generated by this direct approach, it might be difficult to find out the most interesting regions for optimization, specifically in the case of larger applications. The reason: There are a lot of model operators and functions involved in every layer of the code. Also, the Intel VTune Profiler hot spots only give function-level analysis. This may not be very helpful for optimizing machine learning applications because primitive-level profiling is needed to find the performance bottlenecks.
For these reasons, the authors highly encourage the use of ITT APIs for generating more precise and easily interpretable profiling results.
So let’s discuss that.
Use of ITT for Python* APIs
ITT for Python provides Python bindings to the Intel VTune Profiler with ITT APIs. The ITT for Python helps users create task labels, which offer various functionalities for controlling data collection and some task APIs that can create and destroy task instances.
Three types of APIs are used in ITT for Python:
- Domain APIs
- domain_create(name)
- Task APIs
- task_begin(domain, name)
- task_end()
- Anomaly Detection APIs
- itt_pt_region_create(name)
- itt_pt_region_begin(region)
- itt_pt_region_end(region)
Here is an example of Domain and Task APIs of ITT for Python:
itt.resume()

domain = itt.domain_create("Example.Domain.Global")

itt.task_begin(domain, "CreateTrainer")

for epoch in range(0, EPOCHNUM):

 for step in range(0, BS_TRAIN):

 x_batch = x_data[step*N:(step+1)*N, :, :, :]

 y_batch = y_data[step*N:(step+1)*N, :, :, :]

 s.run(train, feed_dict={x: x_batch, y: y_batch})

 '''Compute and print loss. We pass Tensors containing the predicted and  true values of y, and the loss function returns a Tensor containing the loss.'''

 print(epoch, s.run(loss,feed_dict={x: x_batch, y: y_batch}))

itt.task_end(domain)

itt.pause()
This code snippet shows the following steps:
- Resume the profiling right before the loop (the interesting part of the code) starts running using the resume() API.
- Create an ITT domain that is required for most of the ITT API calls. In the example, it is named "Example.Domain.Global".
- Start the ITT task using the task.begin() API and label it as "CreateTrainer", which appears in the profiling results.
- At the end of the loop, end the task using the itt.task() API.
- After the task is complete, pause the collection of profiling data using the pause() API.
Run Hotspot and Microarchitecture Exploration Analysis
Use the following command line to generate the hot spots analysis for the modified code:
vtune -collect hotspots -start-paused -knob enable-stack-collection=true -knob sampling-mode=sw -search-dir=/usr/bin/python3 -source-search-dir=path_to_src -result-dir vtune_data -- python3 TensorFlow_HelloWorld.py
Note An additional parameter -start-paused was added in this command line to profile only the regions marked by ITT for Python APIs.
Here is a snapshot of the hot spot analysis results when Intel VTune Profiler was run on TensorFlow_HelloWorld.py:
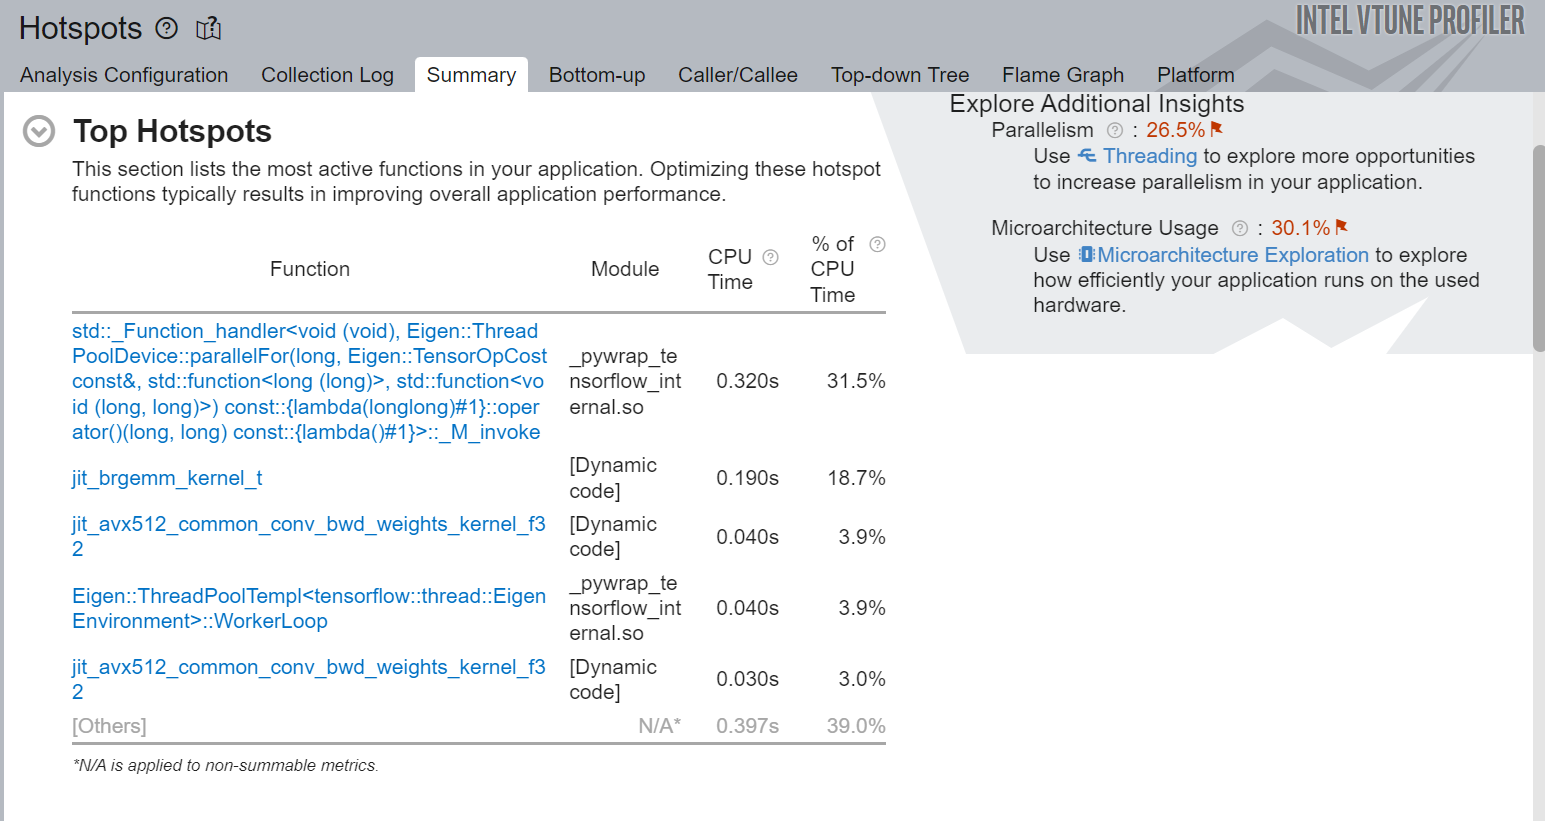
Figure 3. Summary view of the Intel VTune Profiler hot spots analysis
Figure 3 shows the top hot spots of the regions of the code marked by ITT for Python APIs. It also recommends some other analysis, such as, Threading and Microarchitecture Usage, to get deeper analysis of the top hot spots and associated bottlenecks.
Figure 4 is another snapshot of the top tasks targeted by the ITT for Python APIs. One of the major advantages of using ITT for Python APIs for machine learning workloads is that one can see the detailed profiling results only for interesting regions of the source code. In this example, you created two ITT logical tasks: CreateTrainer and CreateOptimizer. By selecting these tasks, you can see the CPU time (effective time, spin time, overhead time), CPU utilization timeline, source code line level analysis, and other information.
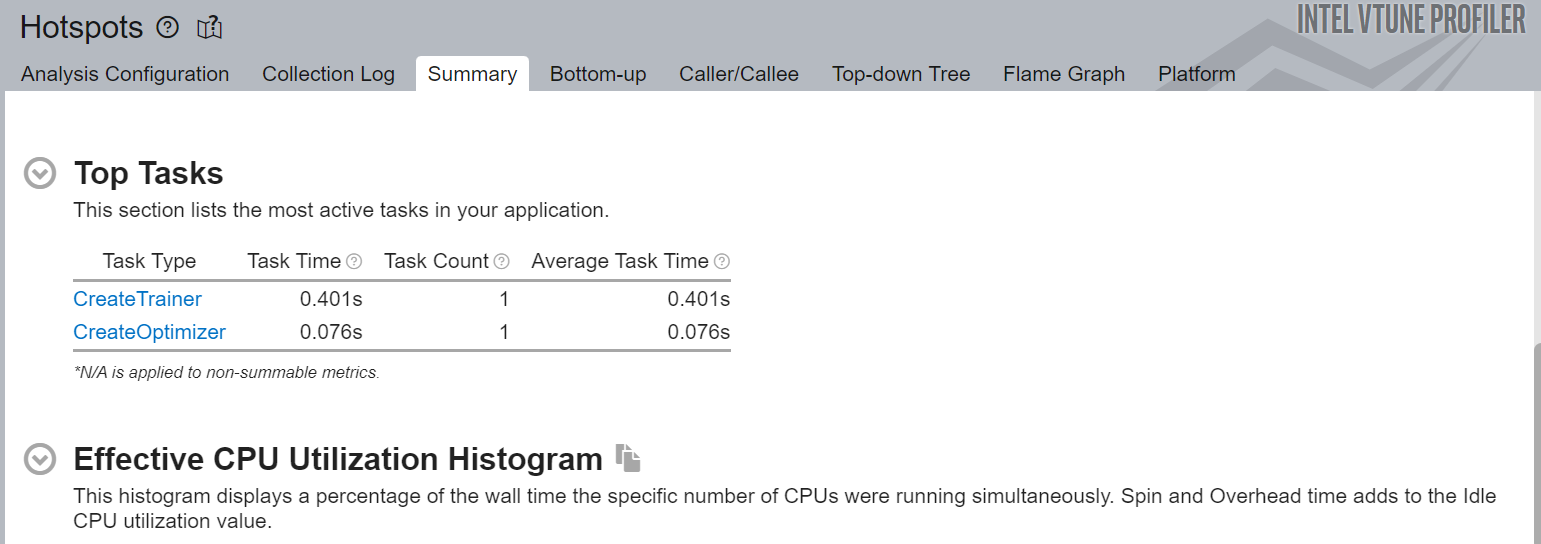
Figure 4. Summary view of hot spots analysis
Figure 5 shows the source-line-level profiling of the machine learning source code and the source-line-level breakdown of CPU Time. In this example, we can see that the code spends 11.8% of the total execution time in training the model.
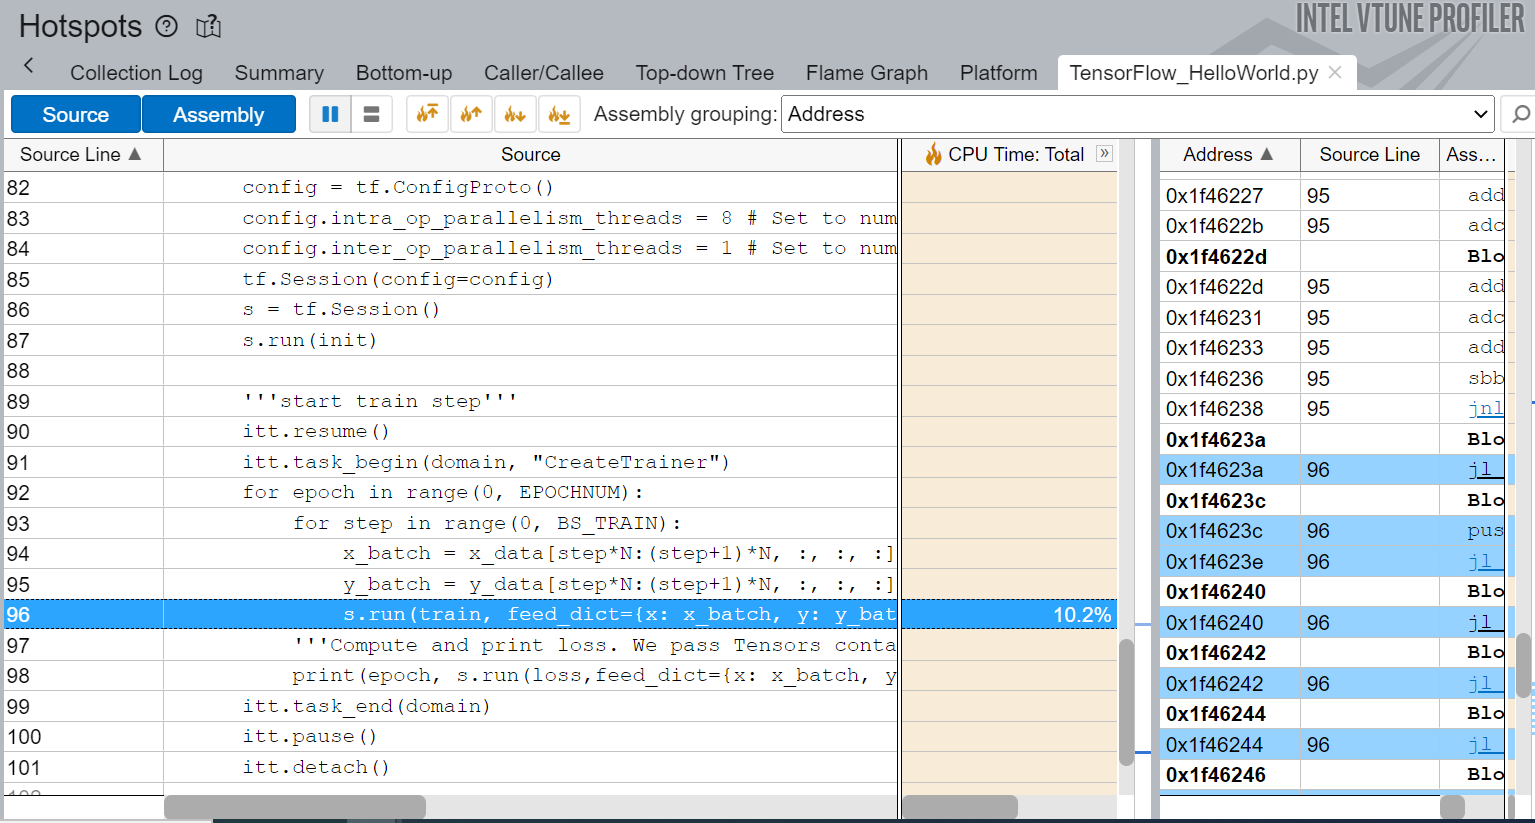
Figure 5. Summary view of hot spot performance analysis
For deeper microarchitecture-level analysis of the application’s performance, you can use Microarchitecture Exploration Analysis Type. Use the following command line to run microarchitecture exploration:
vtune -collect uarch-exploration -knob collect-memory-bandwidth=true -source-search-dir=path_to_src -search-dir /usr/bin/python3 -result-dir vtune_data_tf_uarch -- python3 TensorFlow_HelloWorld.py
Here is a snapshot of the of microarchitecture exploration run on TensorFlow_HelloWorld.py:
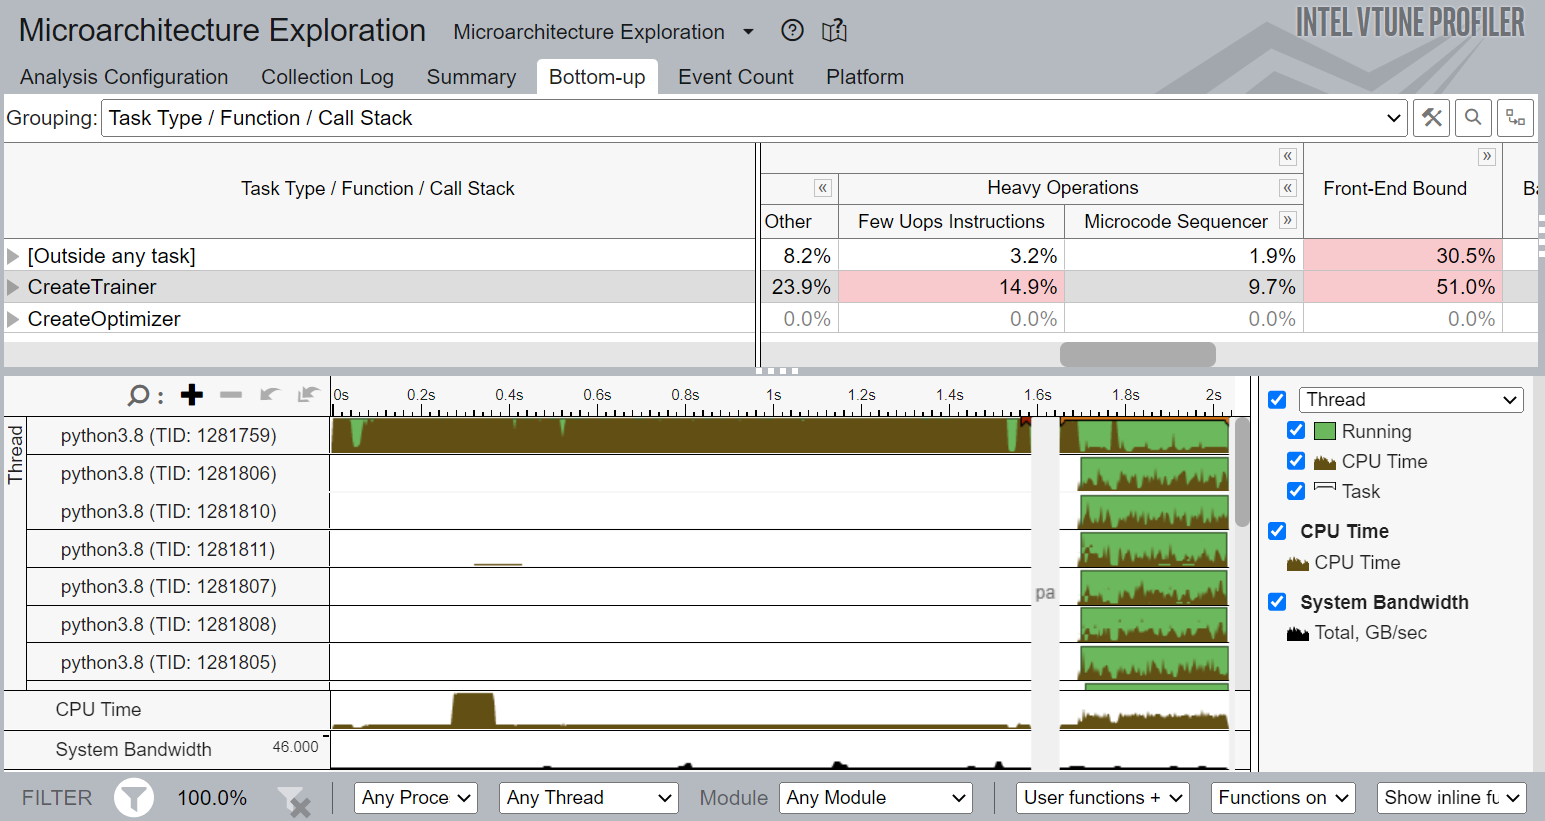
Figure 6. Bottom-up view of microarchitecure exploration
Figure 6 shows that the detailed profiling on CreateTrainer task that you marked using ITT for Python APIs. It is front-end bound, which means for this training task, front end is under-supplying the back end. Also, the percentage of heavy-weight operations (operations needing more than two uops) is also high. This type of analysis can also show the branch misprediction for a certain task and detailed breakdown of stalls due to different levels of memory subsystems (not shown in the figure).
Use PyTorch* Framework ITT APIs
The rich set of ITT APIs have been integrated with PyTorch 1.13. Similar to ITT for Python APIs, PyTorch with ITT APIs have the ability to label the time span of individual PyTorch operators, as well as get detailed analysis results of a customized code region. This makes the profiling of large machine learning applications much easier. The following torch.profiler.itt APIs are now available on PyTorch 1.13:
- is_available()
- mark(msg)
- range_push(msg)
- range_pop()
Here is an example of how torch.profiler.itt APIs can be used to label a certain code region. This example uses a code snippet from Intel_Extension_For_PyTorch_Hello_World.py:
itt.resume()

with torch.autograd.profiler.emit_itt():

 torch.profiler.itt.range_push('training')

 model.train()

 for batch_index, (data, y_ans) in enumerate(trainLoader):

 data = data.to(memory_format=torch.channels_last)

 optim.zero_grad()

 y = model(data)

 loss = crite(y, y_ans)

 loss.backward()

 optim.step()

 torch.profiler.itt.range_pop()

itt.pause()
In this code snippet, you perform the following steps:
- Resume the collection of profiling data.
- To enable the explicit invocation, use the torch.autograd.profiler.emit_itt() API right before the interesting code that we want to profile.
- Push a range onto a stack of nested range span and mark it with a message: ('training').
- Pop a range from the stack of nested range spans using the range_pop() API.
- Pause the profiling data collection using the itt.pause() API.
Collect Profiling Results Using Intel VTune Profiler
Use the following command line to generate a hot spot analysis for the modified code:
vtune -collect hotspots -start-paused -knob enable-stack-collection=true -knob sampling-mode=sw -search-dir=/usr/bin/python3 -source-search-dir=path_to_src -result-dir vtune_data_torch_profiler_comb -- python3 Intel_Extension_For_PyTorch_Hello_World.py
Figure 7 shows the snapshot of top hot spots after adding the PyTorch with ITT APIs to the code:
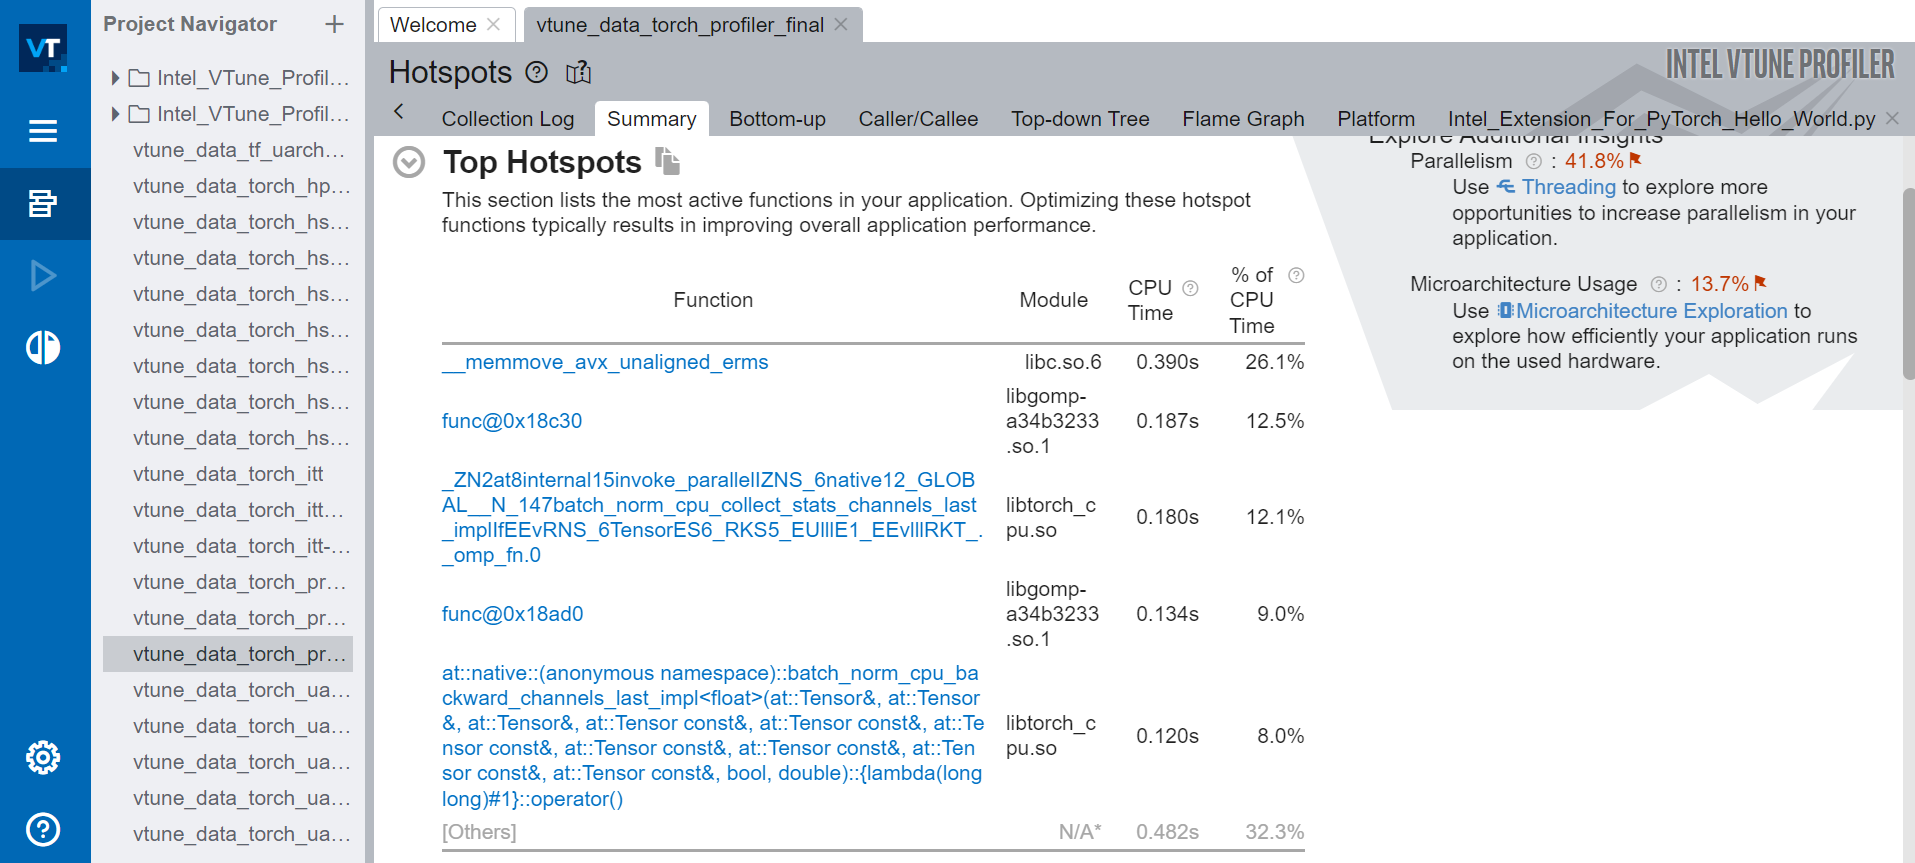
Figure 7. Summary view of the hot spot analysis
Figure 8 shows the top tasks of the code regions targeted by torch.profiler.itt APIs. Here the training task was labelled in the code using ITT APIs:
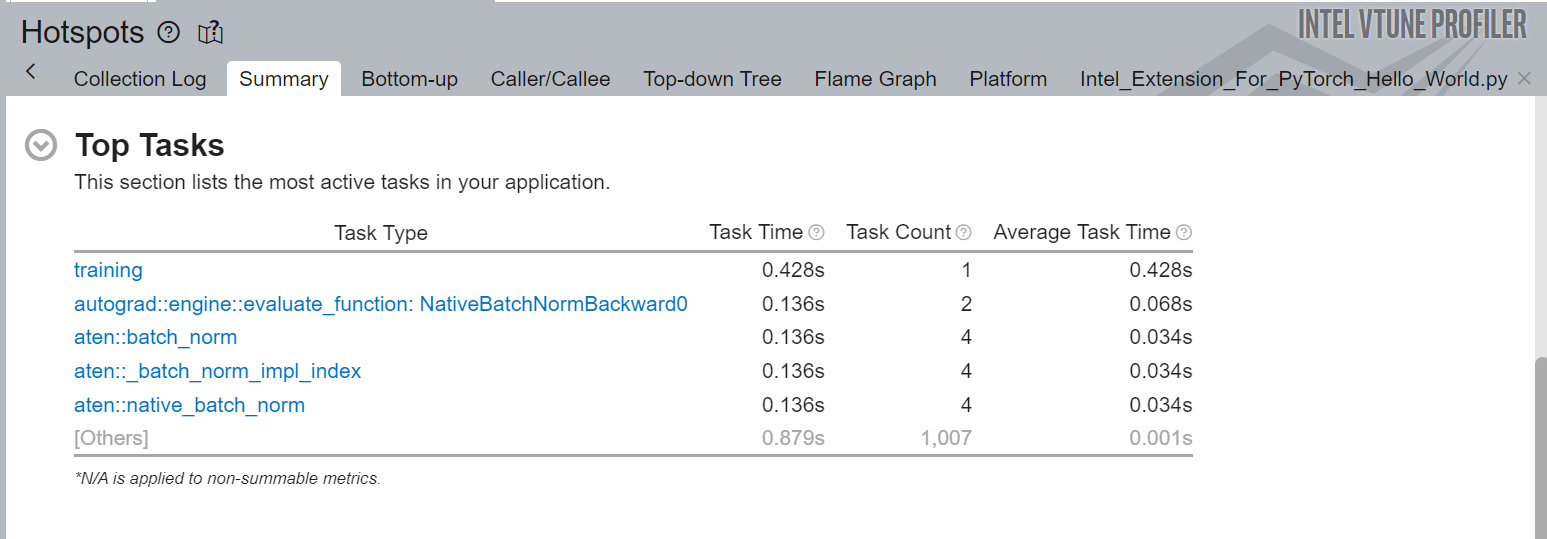
Figure 8. Summary view of hot spots analysis
Figure 9 is a snapshot of the source-line-level profiling of the PyTorch source code. It shows the source-line-level breakdown of CPU Time. In this example, you can see that the code spends 10.7% of the total execution time in backpropagation.

Figure 9. Source view of hot spots analysis
The Platform view of Intel VTune Profiler hot spots is one of the most important interfaces to understand the behavior of a machine learning application. Figure 10 shows the timeline of a training task that you marked using PyTorch with ITT APIs. The top of the timeline shows the main thread as python3(TID:125983). Other individual threads follow it. All operators starting with aten::batch_norm, aten::native_batch_norm aten::batch_norm_i are model operators labeled implicitly by the ITT feature in PyTorch.
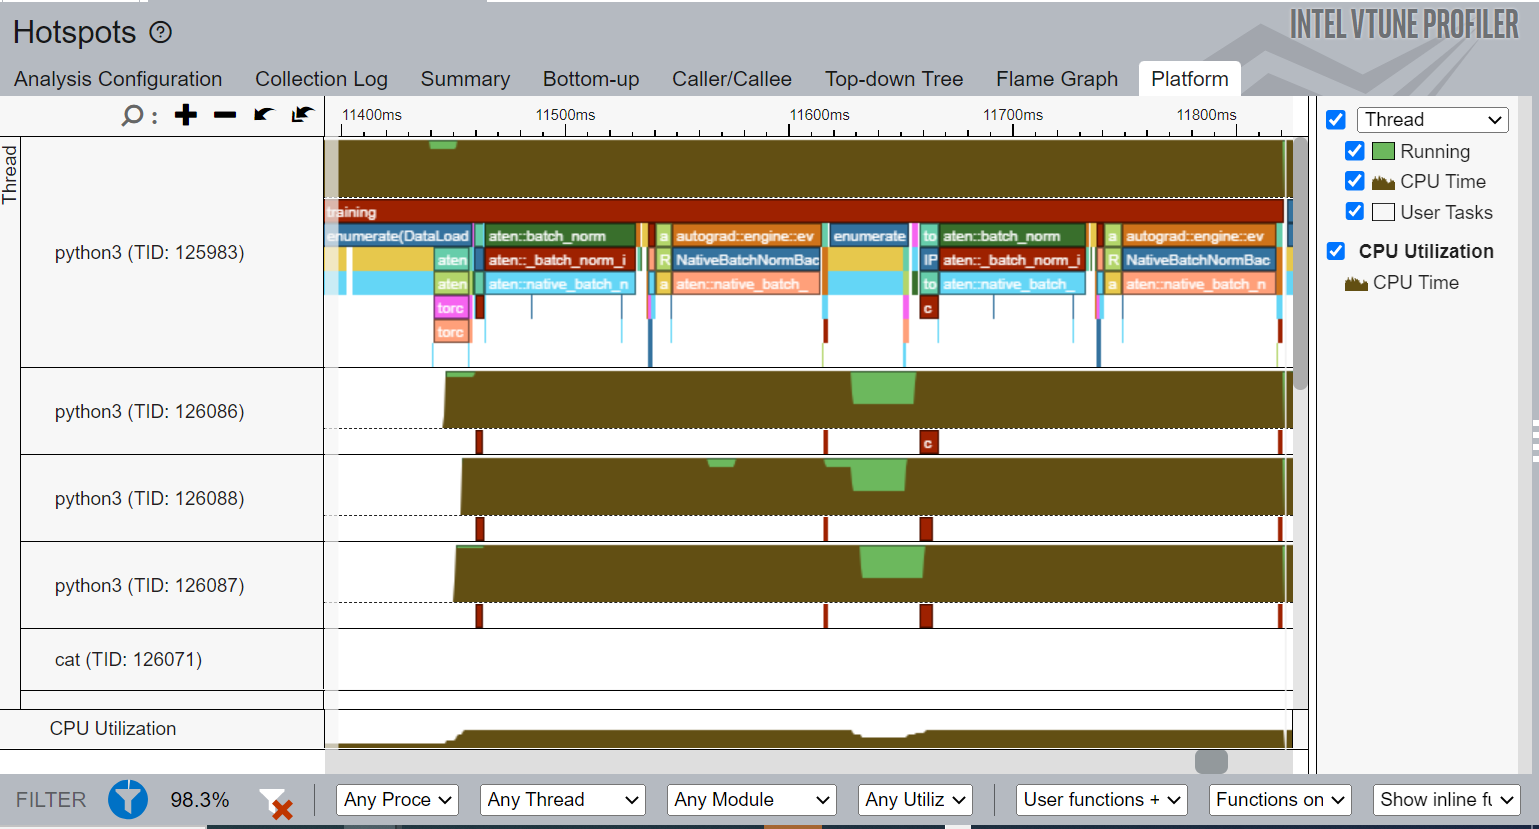
Figure 10. Platform view of the hot spots analysis
The following information can be obtained from the Platform view:
- CPU usage for a certain period for every individual thread.
- Start time, duration of different user tasks, and Intel® oneAPI Deep Neural Network Library (oneDNN) primitives (convolution, reorder).
- You should also be able to see the source lines associated with each user task and primitive by clicking on them if the corresponding source file is compiled with debug information.
- If multiple iterations are available, then the timeline would show the profiling results grouped by iteration number.
Summary
Python support in Intel VTune Profiler with Instrumentation and Tracing Technology APIs provides first-class tools for in-depth performance analysis. Performance optimization of machine learning code is possible all the way down to the primitive coding block and source-line level.
This combined with the visualization capabilities of the Intel VTune Profiler user interface offers everything needed to fine-tune your machine learning applications. They can shine with fast pattern recognition and analysis for your security, retail, quality assurance, traffic safety, or a similar use case.
Beyond the approaches we highlighted for profiling Python, there are a wealth of profiling capabilities for native C++ code that can be considered to augment this discussion. These will be topics for future articles and blogs.
Next Steps
There are lot of other analysis types and profiling options available in Intel VTune Profiler that can help programmers profile and optimize their machine learning application’s performance with minimal effort.
For more information on all available options and profiling techniques, visit Intel® VTune™ Profiler User Guide. For more information on how machine learning code can be optimized for modern Intel® CPUs and GPUs, visit Intel® Optimization for TensorFlow* and Intel® Optimization for PyTorch*.
Get the Software
Download Intel VTune Profiler as a stand-alone product or as part of the Intel® oneAPI Base Toolkit.
Intel® VTune™ Profiler
Find and optimize performance bottlenecks across CPU, GPU, and FPGA systems. Part of the Intel® oneAPI Base Toolkit.