Whether you're a seasoned developer or just starting with Rust, we don’t have to tell you that profiling is hard. However, you can ease the pain using Intel VTune Profiler with ittapi crate.
Intel VTune Profiler is a performance analysis tool that helps developers identify and analyze performance bottlenecks within an application and can collect data on any x86 binary. The ittapi crate is a Rust binding for the Instrumentation and Tracing Technology API (ittapi), which is a set of functions provided by Intel to instrument code for performance analysis with tools like VTune.
To give you a bit of context, imagine you're a Rust developer optimizing the performance of a component responsible for handling file uploads from users in a complex cloud storage service. This component is critical because it directly affects the user experience; slow uploads can lead to customer dissatisfaction. In this scenario, you could use VTune and the ittapi crate to pinpoint specific regions of your Rust codebase where bottlenecks are occurring.
While it’s not news that you can profile Rust x86 binaries with VTune, you might be surprised to learn how controlling VTune's collection behavior with the ittapi crate can help you achieve even better results. Improving your profiling workflow can be achieved through simple recipes, whether it's controlling collection behavior, pausing and resuming profiling, or tracking task-based regions. Using the techniques outlined in this post, you'll learn how to refine VTune's data collection, enabling you to analyze precise regions of code that require optimization. The examples below run on Linux but should port without issue to other platforms supported by Rust and VTune (e.g., MacOS, Windows).
Profiling a Simple Program
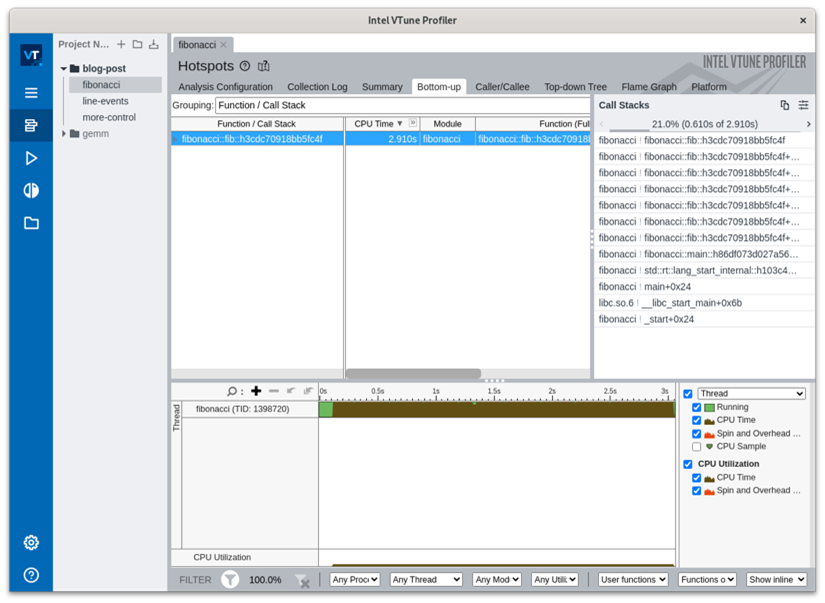
Let's start with a simple example: a basic Rust program that executes a recursive Fibonacci function. Any function will work fine for this demo—we’re using this dummy workload just to show you how VTune profiling works. We can profile this with VTune:
$ cat src/bin/fibonacci.rs
fn main() {
    println!("{}", fib(45));
}
fn fib(n: usize) -> usize {
    match n {
        0 => 0,
        1 => 1,
        _ => fib(n - 1) + fib(n - 2),
    }
}

$ cargo build --release --bin fibonacci
    Finished `release` profile [optimized] target(s) in 0.01s

$ vtune -collect hotspots -result-dir /tmp/vtune/fibonacci target/release/fibonacci
What we’re doing is telling VTune to perform the default collection (-collect hotspots) and dump the collection files in a temporary directory (-result-dir /tmp/vtune/fibonacci). To see a list of a few more profile modes, take a look at vtune -collect help. It’s interesting to note that even in release mode, Rust binaries still have enough symbol information for this kind of profile to work. See Cargo's debug setting if you need to fine-tune this.
Asserting More Control
In some scenarios, you may need to assert more control, for example, if you need to measure only a specific portion of the program's execution. Imagine you have a large, complex application but you don’t want (or simply can’t) compile a region of interest into a separate binary. This could pose a challenge, especially if the region of interest spans multiple functions or lacks debug symbols. To get precise control over VTune’s data collection, use the ittapi library.
To use the ittapi library to control VTune's data collection, you’ll need to include it as a dependency, as shown here:
$ cat src/bin/more-control.rs
use std::{thread::sleep, time::Duration};
fn main() {
ittapi::pause();
setup(); // Do not collect the half second of setup time.
ittapi::resume();
println!("{}", fib(45));
}
fn setup() {
sleep(Duration::from_secs_f32(0.5));
}
...
$ cargo build --release --bin more-control
Finished `release` profile [optimized] target(s) in 0.12s
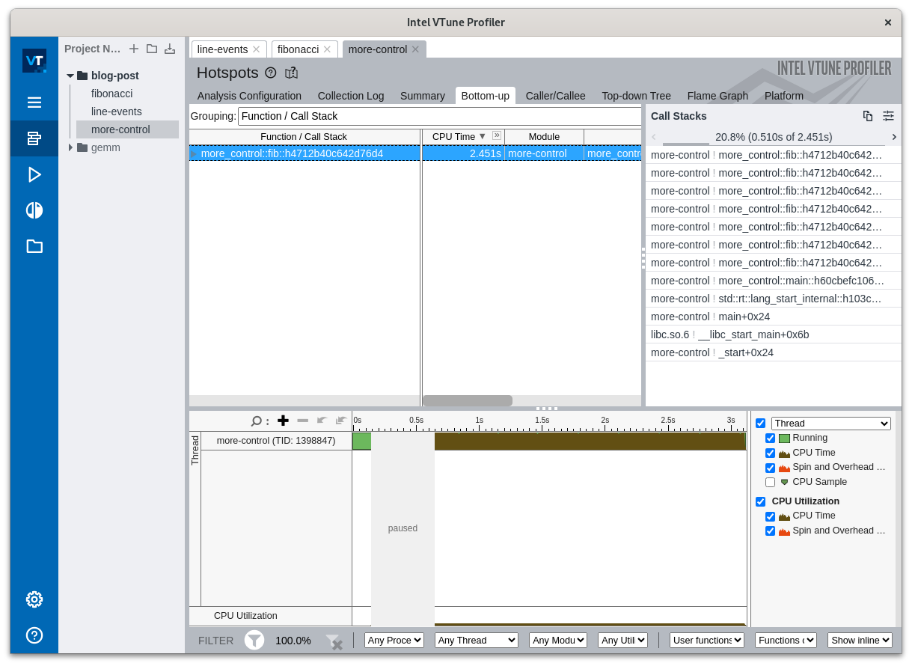
$ vtune -collect hotspots -result-dir /tmp/vtune/more-control target/release/more-control
...
As you can see in the example below, in the grey box that says “paused” VTune ignores the half second of setup time on your timeline. The added ittapi calls will not impact the program if run normally, outside of VTune. Remember, this detail is important because it helps you navigate the system so that, ultimately, you get your profiling finished faster and save time for both you and your company.
Profiling Events
In more complex collection scenarios, you’ll need to know how to profile events. In a large application, e.g., a web server managing many HTTP requests, these HTTP requests, or events, repeat throughout the program's execution. With the ittapi crate, we can mark these regions with an event, which can either mark a point in time or span the duration of an executed region. In Rust, an event will end when it goes out of scope (or when manually dropped).
To mimic this type of "repeated event" usage, let's read in a large file and count the characters on each line, sleeping some random time between lines. We'll inform VTune about each line being processed by marking it with a duration “event” as in the code sample below:
...
fn main() {
let mut rng = rand::thread_rng();
let mut chars = 0;
let mut lines = 0;
let event = Event::new("line-count");
for line in io::stdin().lock().lines() {
{
let _ = event.start();
chars += line.unwrap().len();
lines += 1;
// Event stopped here on `drop`.
}
sleep(Duration::from_millis(rng.gen_range(0..15)));
}
println!("lines = {lines}, characters = {chars}");
}
$ cargo build --release --bin line-events
Finished `release` profile [optimized] target(s) in 0.01s
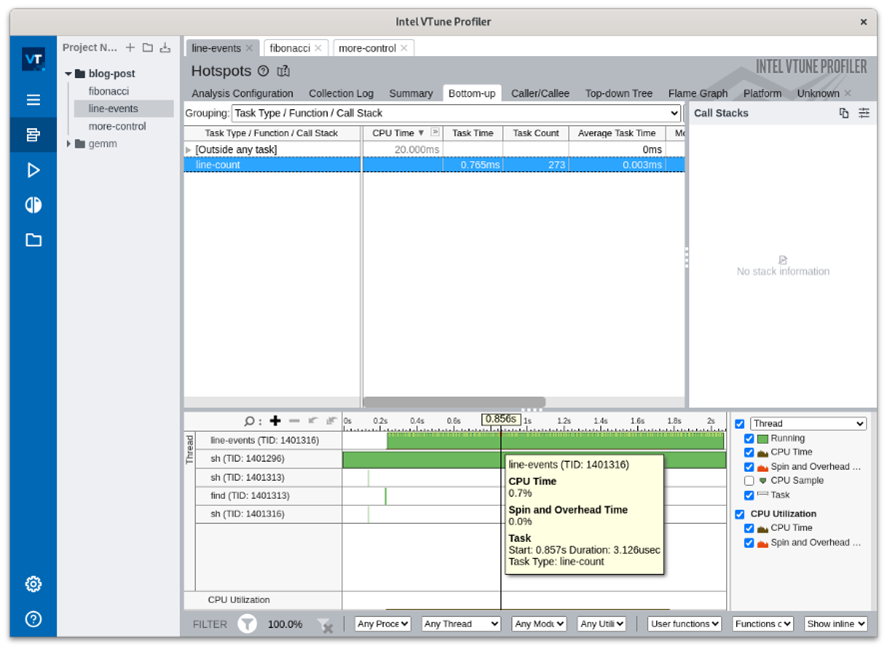
$ vtune -collect hotspots -result-dir /tmp/vtune/line-events sh -c "find . -not -path './target/*' | target/release/line-events"
...
When you feed VTune the non-binary files in your project and notice that the line-counting events are much shorter than the sleep periods, you’ll see that it results in a very sparse timeline. Without this fine-grained “event” collection, you would miss the code you're interested in. Notice in the image below that the line-count tick marks (the tiny yellow ones on the timeline) allow you to precisely focus your analysis.
Integration with Cargo Bench
Many Rust projects perform benchmarking via the cargo bench command because it provides a convenient and integrated way to run benchmarks. The command is built into Cargo, Rust's package manager and build system, which makes it easily accessible to Rust developers. The multi-run statistical analysis from this tool is great, but wouldn't it be nice to understand why some versions are faster? To do this, you’ll need to instrument the benchmarks of an existing Rust project, gemm, which exhaustively compares general matrix multiplication over many parameters.
The code example below demonstrates how to instrument the benchmark with Domains and Tasks: a “Domain” groups together data from different modules and a “Task” represents a logical unit of work. (Note in the previous section how VTune thinks of “Events” as specialized “Tasks.”) The setup is a bit involved (think patch.crates.io to instrument this project's choice of benchmark harness) but it’s conceptually simple:
@@ -886,6 +886,8 @@ impl Bench {
    let mut ctx = BenchCtx {
        timings: Vec::new(),
    };
+   let domain = ittapi::Domain::new(name);
+   let task = ittapi::Task::begin(&domain, arg_str);
    f.call_mut(
        Bencher {
            ctx: &mut ctx,
            config,
        },
        dyn_clone::clone_box(&**arg),
    );
+   task.end();
    ctx.timings.sort_unstable();
    let mut metric = vec![];
    let mut metric_mean = 0.0;
With that in place, run gemm's benchmarks as usual, only inside VTune's collector.
$ vtune -collect hotspots -result-dir /tmp/vtune/gemm cargo bench --bench bench -- --name bench_gemm\<f64\> --arg 128
...
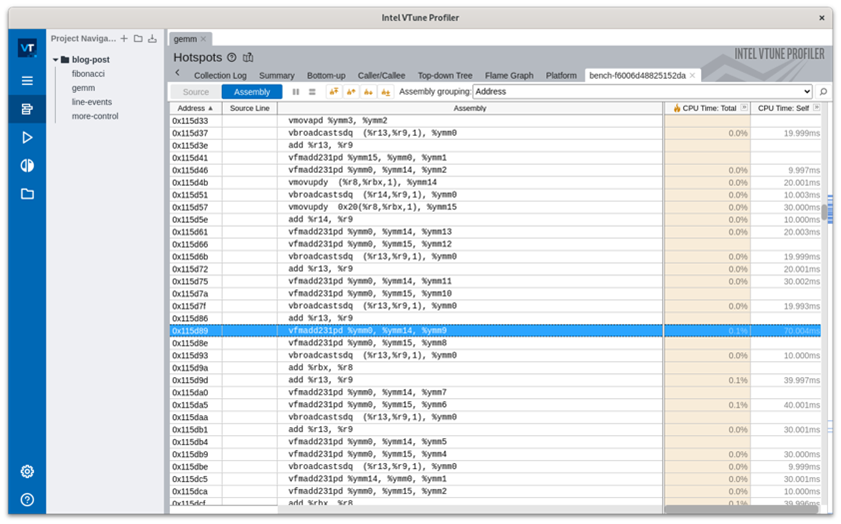
In the image below, you can now visualize which run (i.e., the specific set of gemm benchmark parameters) to focus on in the timeline by filtering by Domain and Task (e.g., bench_gemm<f64> and None, Col, Col, Row, 128, 128, 128).
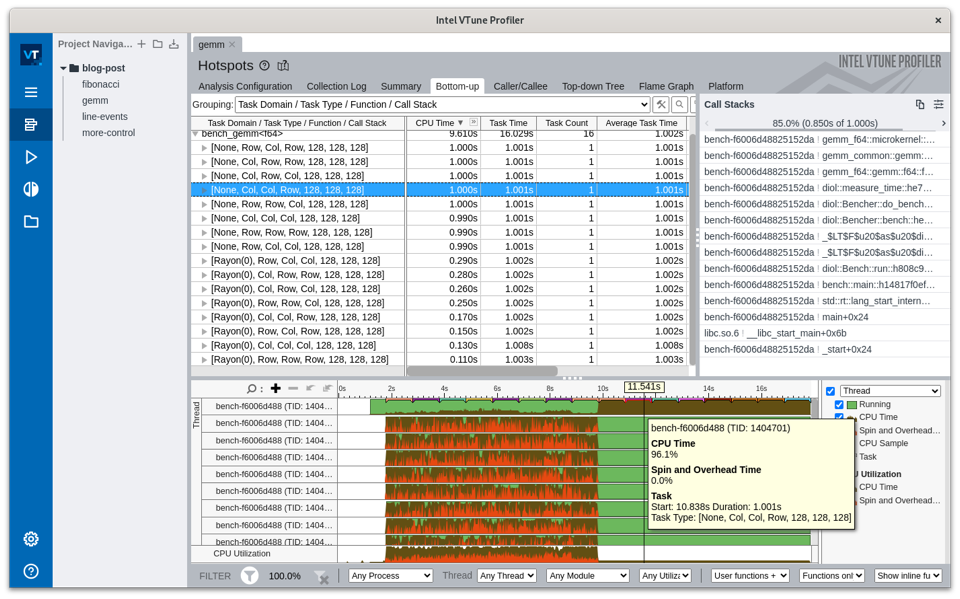
To understand why this run was slower or faster, navigate to the compiled assembly code for the top function for this task. The important takeaway here is that you can see the difference in the speed. Note that this is possible for the examples above as well.
Extending Beyond Task Tracking
Controlling VTune profiling with ittapi calls extends beyond pause/resume functionalities and task tracking. For example, programs utilizing just-in-time (JIT) code generation can leverage ittapi to register code with VTune, improving the profiling experience of the JIT-generated code by making JIT symbols available (see the jit documentation). Feel free to open an issue on the issue tracker if you're interested in other use cases or if something doesn't work quite right. When working with VTune and Rust, try the ittapi crate for fine-tuning your performance analysis.
For more information, check out these additional resources:
About the Author
Andrew Brown, Intel Software Engineer
Andrew Brown is a software engineer currently focused on WebAssembly (and occasionally Rust). He has championed several WASI proposals and is working on optimizations to improve Intel performance for WebAssembly runtimes, notably the Rust-based Wasmtime.
Nikki McDonald, Content Manager, Intel Open Ecosystem
Focused on educating and inspiring developers for over a decade, Nikki leads the strategy and execution for open source-related content at Intel. Her mission is to empower our open source community to grow their skills, stay informed, and exchange ideas. An avid reader, you’ll never find her without her Kindle. Connect with her on LinkedIn and X.