Beginning with TensorFlow* 2.14, a new Intel® VTune™ Profiler API gives deep learning developers a better way to analyze workload performance and identify performance hotspots, thread synchronization overhead, hardware-level bottlenecks, processor utilization issues, excessive memory access and consumption, and more. This blog introduces the Instrumentation and Tracing Technology API (ITT API) and provides examples using this API and the VTune™ Profiler to collect and visualize performance issues in your TensorFlow-based deep learning applications.
In this blog, you will learn:
- What is Intel® VTune™ Profiler
- What is the Instrumentation and Tracing Technology (ITT) API
- How the ITT API benefits TensorFlow workload profiling
- How to create a profile using the ITT API with the Intel AI Analytics Toolkit Docker image
What is Intel® VTune™ Profiler
Intel® VTune™ Profiler is a performance analysis tool for serial and multithreaded applications. It provides a rich set of metrics to help developers understand how their application is executed on Intel platforms and helps identify performance bottlenecks.
What is the Instrumentation and Tracing Technology (ITT) API
For deep learning programmers, identifying function hotspots is often less useful than identifying primitive-level or deep learning operations-level hotspots. For this, we introduced the Instrumentation and Tracing Technology Application Programming Interfaces (ITT API) to generate and control collection of VTune™ Profiler trace data of oneDNN primitive execution, for both Intel CPUs and GPUs.
The ITT API labels the time span of individual TensorFlow operators, as well as customized regions, as shown in the VTune™ Profiler GUI. When you find some abnormal performance, this extra information helps you locate which operator behaved unexpectedly.
How the ITT Feature Benefits TensorFlow Workloads Profiling
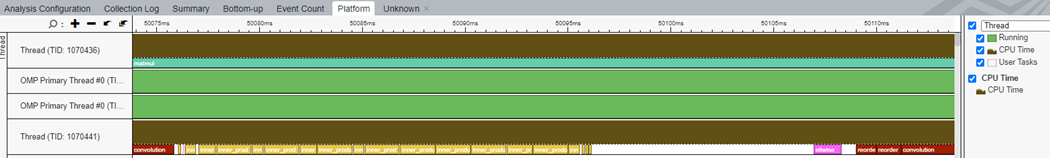
1. View potential performance issues using the primitives timeline in VTune™ Profiler.
In Figure 1, the convolution, inner production, eltwise, and reorder primitives are tagged in the timeline chart, along with their corresponding threads. There are two reorder operations between eltwise and convolution that could be reduced to improve performance, indicated by the red boxes at the bottom of this figure.
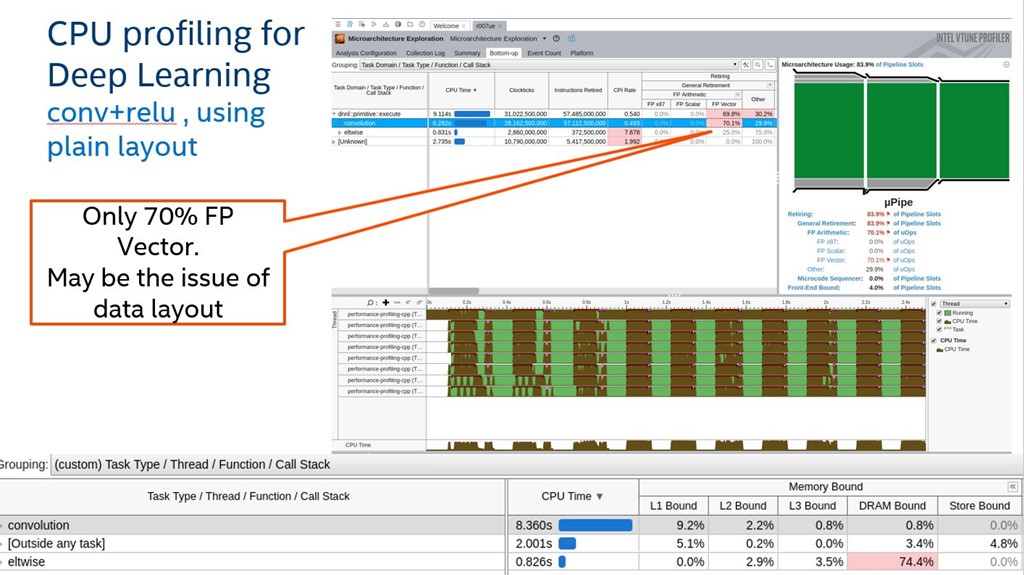
2. View platform information such as L1/L2 cache miss or level of FP vectorization on primitive level.
Figure 2 shows group profiling results by Task Types. VTune™ Profiler will further group information by oneDNN primitives tagged as different Task Types. This lets you see platform level detail information on a primitive level, such as FP vectorization or DRAM Bound, and helps you understand performance issues such as only 70% FP vectorization and 74.4% DRAM Bound among oneDNN primitives.
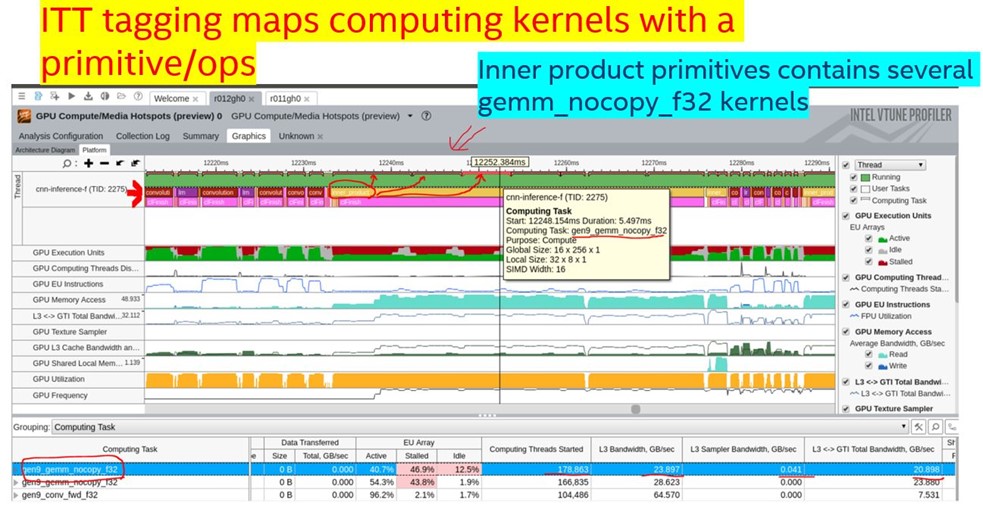
3. Map primitives with related computation kernels.
By tagging primitives, the ITT API can also map primitives with computation kernels to help you understand what computation kernels are called with each primitive. Figure 3 shows that one inner primitive (circled in red) uses several GPU gen9_gemm_nocopy_f32 kernels (indicated by red arrows).
Simple Sample Showcasing How to Profile with ITT API Feature
In this sample, we use a simple TensorFlow workload with only convolution and ReLU operations from the oneAPI samples GitHub repository, and the Intel® AI Analytics Toolkit (AI Kit) Docker image with VTune™ Profiler and TensorFlow Conda* environment installed.
Environment Setup
You must have Docker installed. Use these commands to pull the oneapi-aikit 2023.2 Docker image and be put in a bash shell with all AI Kit components ready for use:
wget https://raw.githubusercontent.com/oneapi-src/oneAPI-samples/master/AI-and-Analytics/Getting-Started-Samples/IntelAIKitContainer_GettingStarted/run_oneapi_docker.sh

chmod +x run_oneapi_docker.sh

./run_oneapi_docker.sh intel/oneapi-aikit:2023.2.0-devel-ubuntu22.04
In the 2023.2 AI Kit, we have TensorFlow 2.13, but we need to upgrade to TensorFlow 2.14 to use this ITT new feature. Follow these commands to upgrade the TensorFlow version in the Docker instance you are using.
conda create --name tensorflow-2.14 --clone tensorflow

source activate tensorflow-2.14

pip uninstall intel-tensorflow

pip install tensorflow
Profile simple TensorFlow sample with different profiling type
There are different VTune analysis types. We demonstrate how to use the ITT API features with different profiling types using a TensorFlow simple workload.
First, get the simple TensorFlow workload and activate tensorflow-2.14 conda environment:
wget https://raw.githubusercontent.com/oneapi-src/oneAPI-samples/master/AI-and-Analytics/Getting-Started-Samples/IntelTensorFlow_GettingStarted/TensorFlow_HelloWorld.py

source activate tensorflow-2.14
1. HotSpot Analysis
HotSpot analysis identifies sections of code that take a long time to execute (hotspots). Use this command to profile the TensorFlow workload with HotSpot profiling.
vtune -collect hotspots -data-limit=5000 -knob sampling-mode=hw -knob sampling-interval=0.1 -result-dir r001hs -quiet python TensorFlow_HelloWorld
When finished, use this command to launch the VTune™ Profiler Web UI and use your web browser to view the results.
vtune-backend --allow-remote-access option --data-directory=./
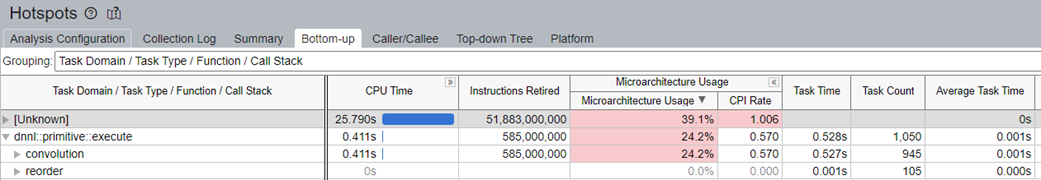
We suggest creating a custom grouping for the Bottom-up Tab, and then group by "Task Domain / Task Type / Function / Call Stack". Refer to menu customize grouping for detailed instructions.
For HotSpot profiling as shown in Figure 4, pay attention to Task Time and Task Count.
2. Threading Analysis
Use this to collect data on how an application is using available logical CPU cores, discover where parallelism is incurring synchronization overhead, identify where an application is waiting on synchronization objects or I/O operations, and discover how waits affect application performance.
Use this command to profile the TensorFlow workload with Threading profiling.
ulimit -n 128000; vtune -collect threading -data-limit=5000 -knob sampling-and-waits=hw -knob sampling-interval=0.1 -result-dir r001tr -quiet python TensorFlow_HelloWorld.py
When finished, use this command to launch the VTune™ Profiler Web UI and use your web browser to view the results.
vtune-backend --allow-remote-access option --data-directory=./
We suggest creating a custom grouping for the Bottom-up Tab, and group by "Task Domain / Task Type / Function / Call Stack". Refer to menu customize grouping for detailed instructions.
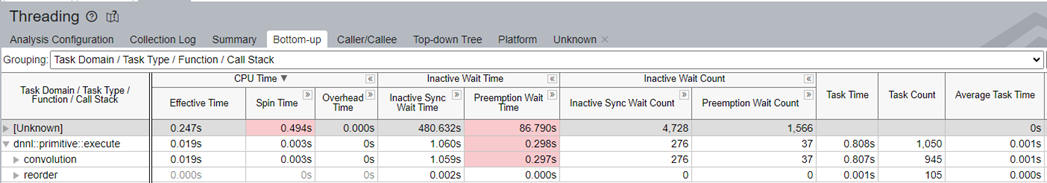
For Threading profiling a shown in Figure 5, pay attention to Spin Time, Preemption Wait Time, and Sync Wait Time.
3. Microarchitecture Exploration Analysis
This collects hardware events for analyzing a typical client application and calculates a set of predefined ratios used for the metrics to help identify hardware-level performance problems.
Use this command to profile the TensorFlow workload with Microarchitecture Exploration profiling.
vtune -collect uarch-exploration -data-limit=5000 -knob sampling-interval=0.1 -result-dir r001ue -quiet python TensorFlow_HelloWorld.py
When finished, use this command to launch the VTune™ Profiler Web UI and use your web browser to view the results.
vtune-backend --allow-remote-access option --data-directory=./
We suggest customizing grouping for the Bottom-up Tab, and group by "Task Domain / Task Type / Function / Call Stack". Refer to menu customize grouping for detailed instructions.
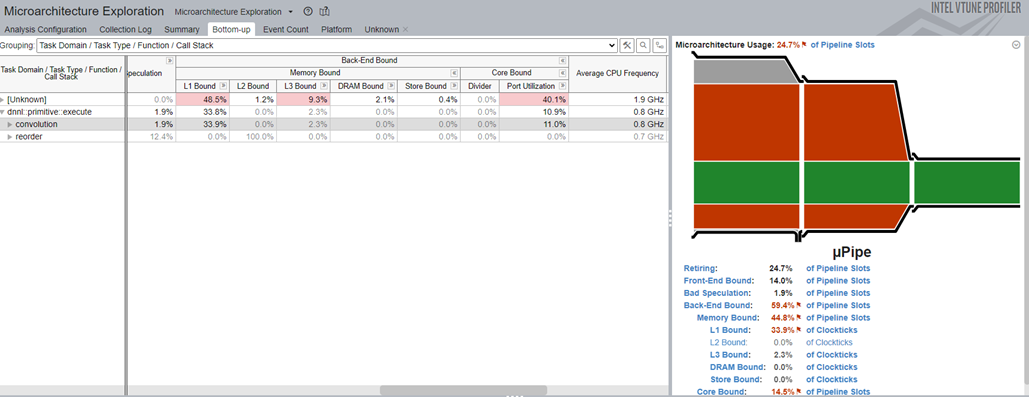
For Microarchitecture Exploration profiling as shown in Figure 6, pay attention to L1, L2, L3, DRAM Bound and Core Bound.
4. High Performance Compute Analysis
Identify opportunities to optimize CPU, memory, and FPU utilization for compute-intensive or throughput applications. Use this command to profile the TensorFlow workload with Microarchitecture Exploration profiling.
vtune -collect hpc-performance -data-limit=5000 -knob sampling-interval=0.1 -result-dir r001hpe -quiet python TensorFlow_HelloWorld.py
When finished, use this command to launch the VTune™ Profiler Web UI and use your web browser to view the results.
vtune-backend --allow-remote-access option --data-directory=./
We suggest customizing grouping for the Bottom-up Tab, and group by "Task Domain / Task Type / Function / Call Stack". Refer to menu customize grouping for detail instructions.
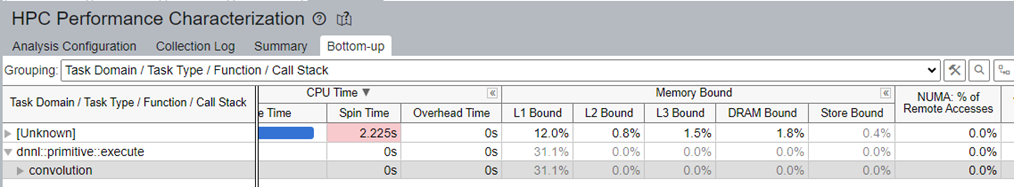
For High Performance Compute profiling as shown in Figure 7, pay attention to Spin Time, Memory Bound, and NUMA Remote Accesses.
5. Memory Access Analysis
Identify memory-related issues, such as NUMA problems and bandwidth-limited accesses. Attribute performance events to memory objects (data structures) are provided by instrumentation of memory allocations/de-allocations and getting static/global variables from symbol information.
Use this command to profile the TensorFlow workload with Memory Access profiling.
vtune -collect memory-access -knob sampling-interval=0.1 -result-dir r001ma -quiet python TensorFlow_HelloWorld.py
When finished, use this command to launch the VTune™ Profiler Web UI and use your web browser to view the results.
vtune-backend --allow-remote-access option --data-directory=./
We suggest customizing grouping for the Bottom-up Tab, and group by "Task Domain / Task Type / Function / Call Stack". Refer to menu customize grouping for detailed instructions.
For Memory Access profiling as shown in Figure 8, pay attention to Memory Bound and LLC Miss Count.

6. Memory Consumption Analysis
Analyze memory consumption by your Linux application, its distinct memory objects, and their allocation stacks.
Use this command to profile the TensorFlow workload with Memory Consumption profiling.
vtune -collect memory-consumption -data-limit=5000 -result-dir r001mc -quiet python TensorFlow_HelloWorld.py
When finished, use this command to launch the VTune™ Profiler Web UI and use your web browser to view the result.
vtune-backend --allow-remote-access option --data-directory=./
We suggest customizing grouping for the Bottom-up Tab, and group by "Task Domain / Task Type / Function / Call Stack". Refer to menu customize grouping for detailed instructions.
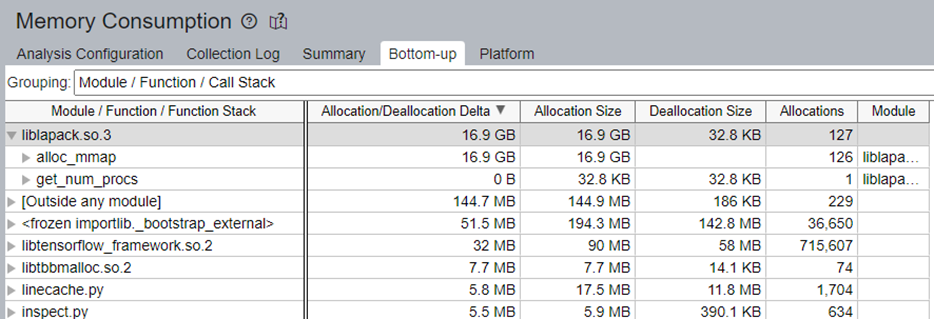
For Memory Consumption profiling as shown in Figure 9, pay attention to Allocation/Deallocation Delta.
Profile Region of Interest by Using itt-python
It might take hours to finish one run of an AI workload, but you do not need to profile full runs to get meaningful performance data. Instead, you can profile only the regions of interest in a much shorter time by using calls to itt-python, which contains Python bindings to the IIT APIs.
Environment Setup
To get itt-python support, install one additional python package using this command:
conda install -c conda-forge itt-python
Code Changes for Collection and Control
To only profile a region of interest, you identify those regions in your code. After importing the itt module in your Python code, you bracket regions of interest with calls to itt.resume and itt.detach or itt.pause, as demonstrated here:
import itt
# ... uninteresting code

itt.resume()
# ... interesting code

itt.pause()
# ... boring stuff again

itt.resume()
# ... interesting code

itt.detach()
# ... uninteresting code like writing output (sheesh)
When you start the VTune™ Profiler, add an additional argument "-start-paused" so profiling data is not collected until a call to itt.resume.
Here is an example to do hotspot profiling on the simple TensorFlow workload with this collection and control feature.
vtune -collect hotspots -start-paused -data-limit=5000 -knob sampling-mode=hw -knob sampling-interval=0.1 -result-dir r001hs -quiet python TensorFlow_HelloWorld
Conclusion
This blog introduces the Intel® VTune™ Profiler Instrumentation and Tracing Technology API (ITT API) provided for TensorFlow* 3.14 and provides examples using this API to collect and visualize performance issues in your TensorFlow-based deep learning applications.
We encourage you to use these resources and learn more about the ITT API and how to use the Intel® VTune™ Profiler to improve your own applications: