Introduction
Professor Yong Su Jung at the Computational Aerodynamics and Rotorcraft Lab at Pusan National University (PNU) developed a numerical flow simulation model and deployed it on its in-house high-performance computing (HPC) resources. This effort is part of their in-depth research on applied aerodynamics with applications in aircraft and rotorcraft. The flow simulation lab has developed the advantage of computational fluid dynamics (CFD) code based on 2D Reynolds-Averaged Navier-Stokes (RANS) equations, employing diverse numerical methods. The CFD code efficiently solves a substantial system of equations with hundreds of thousands of parameters. The workload executes numerous vector operations, which contribute a significant portion to the computational cost of CFD. Therefore, the efficiency of these vector operations directly influences the code's overall performance.
Challenge: Performance Improvement
In HPC and computational simulation, not achieving the desired level of performance can be a major pain point. Resolving performance issues can take considerable time and effort. It also frequently requires an in-depth understanding of the software stack. Even with cross-architecture platforms using the latest technology, various workloads often require individual optimization. To this end, the role of toolchains such as libraries, compilers, and analysis tools that can take advantage of the latest hardware platform's technology is bound to be very important. PNU did find performance issues in some of their specific workloads, requiring a path toward optimizing how they run. Experiments running the workload on new HPC systems could not boost performance. Running the numerical simulation model remained slower than expected. Scientists did not know how to optimize it but did not want to settle, as slower performance could adversely affect scientific development.
Solution: Analyze and Optimize with Intel® VTune™ Profiler
Intel VTune Profiler was used to view the hierarchy of the loops in the CFD code for optimization. After examining the code, we found the exact location of the hot spot. Figure 1 shows a compiler optimization report showing the hot spot location.

Figure 1. The GaussSeidel_single function is the hot spot according to Intel VTune Profiler results.
We found that the loop was not vectorized because of a vector dependency in the GaussSeidel_single function, as shown in figure 2.
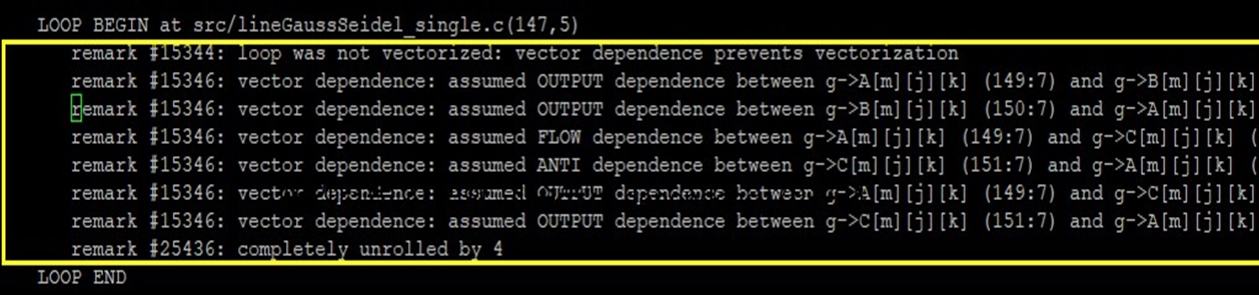
Figure 2. Optimization report from the Intel® oneAPI DPC++/C++ Compiler showing vector dependencies
Ensuring that the semantic dependency did not represent a real dependency in the execution flow, we used directive #pragma ivdep in the not-vectorized loop to ensure loop vectorization. After recompiling, the potential speedup is 1.71x in the same loop, as shown in figure 3.
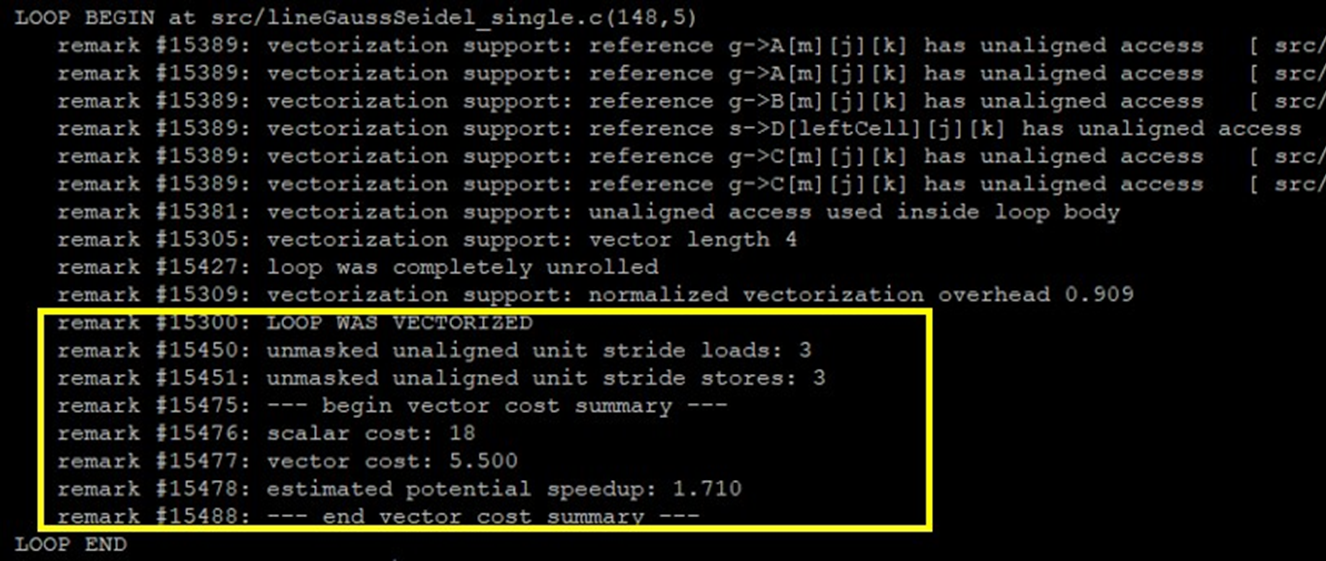
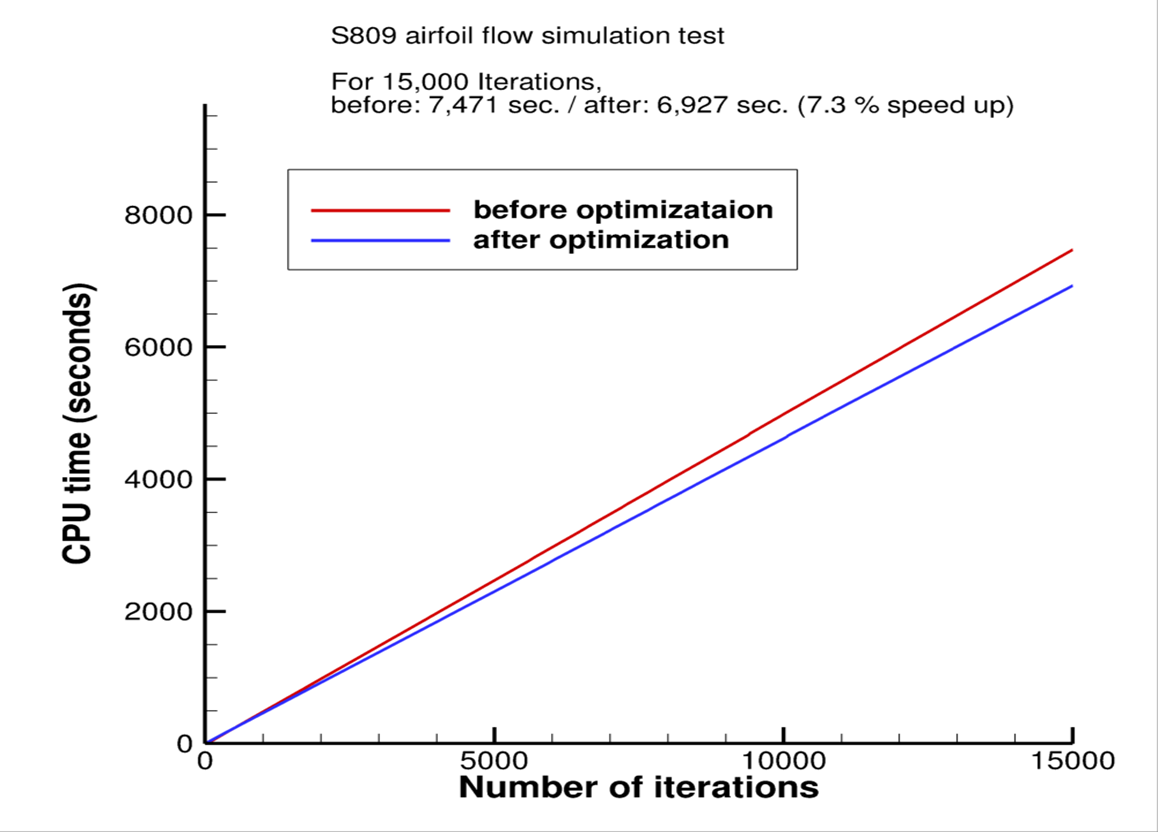
Figure 3. Seven percent performance boost after applying this method to the whole code
Testing Date: Performance results are based on testing by PNU as of August 3, 2023, and may not reflect all publicly available updates.
Configuration Details and Workload Setup:
Test by PNU as of August 3, 2023. Intel® Xeon® Gold processor (6330, 42 M cache, 2.00 GHz) 25 nodes. (2-socket) - M50CYP1UR204 (Intel system) Network: 10 GB ethernet. One node (56 cores) for graph.
- Workloads: S809 airfoil flow simulation test
- Intel VTune Profiler: 2021.3
Conclusion
Achieving performance gains for individual workloads can be quite complex and cost-intensive. However, suppose these optimizations can be carried out using sophisticated, comprehensive build toolchains, including performance libraries, compilers, and software analysis tools. In that case, it will be one of the easier approaches. Using Intel VTune Profiler, part of the Intel® oneAPI Base Toolkit, is a very effective approach for achieving performance gain, resulting in cost and time savings.
Explore More
Download the tools.
Get the full complement of Intel® oneAPI Toolkits including:
Intel VTune Profiler Performance Analysis Cookbook