A newer version of this document is available. Customers should click here to go to the newest version.
Window: Sources
To access this Intel Inspector window: In the Summary window, double-click result data.
The Sources window shows a snapshot of source code for code locations and parent code locations associated with a detected problem. It also provides access to generic explanations of the errors associated with detected problems and corresponding source code in your default editor. Use this window to:
Explore the relationship among code locations associated with a problem.
Examine a snapshot of the relevant source code.
Start resolving issues.
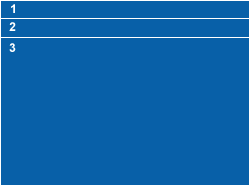
During Analysis
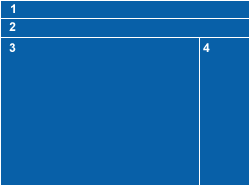
Window Layout
|
Window Panes and Toolbars
|
After Analysis is Complete
Window Layout
|
Window Panes and Toolbars
|

