A newer version of this document is available. Customers should click here to go to the newest version.
Visible to Intel only — GUID: GUID-D2DAE4CC-B357-4E9F-A99A-A53BE5ADEDC9
Visible to Intel only — GUID: GUID-D2DAE4CC-B357-4E9F-A99A-A53BE5ADEDC9
Interpreting Result Data from the Command Line
Result data is easiest to interpret when viewed in the Intel Inspector GUI, which provides multiple views of the result and easy access to tools that you can use to manage and resolve detected problems. However, you can use the inspxe-cl command to generate reports that can be viewed outside the GUI and saved for future reference.
The quickest ways to launch a result are:
With a command window open, enter inspxe-gui. This opens the most recently created result in the Intel Inspector GUI.
Double click the result file. This opens the result in an IDE, if one is configured as a preference, or the Intel Inspector GUI.
Report Example: Summary
By default, a Summary report is automatically generated and saved after a result is created. Here is a Summary report displayed in stdout, with a breakdown by state of memory problems found in the myRes007mi2 result:
2 problem(s) found
2 Not investigated
Breakdown by state:
2 New
|
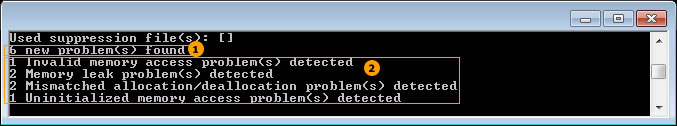
6 new problem(s) found = Total new problem sets that do not match rule(s) in provided suppression file (no suppression file provided in this example) |
|
New problem sets by problem type |
Report Example: Status
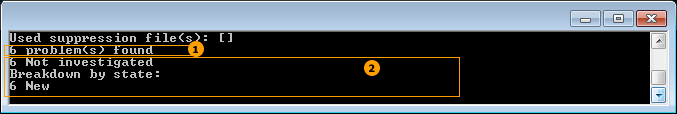
Print to stdout a breakdown by state of new memory problems found in the myRes007mi2 result:
inspxe-cl-report status -result-dir myRes007mi2
|
6 new problem(s) found = Total new problem sets that do not match rule(s) in provided suppression file (no suppression file provided in this example) |
|
New problem sets by state |
Report Example: Problems
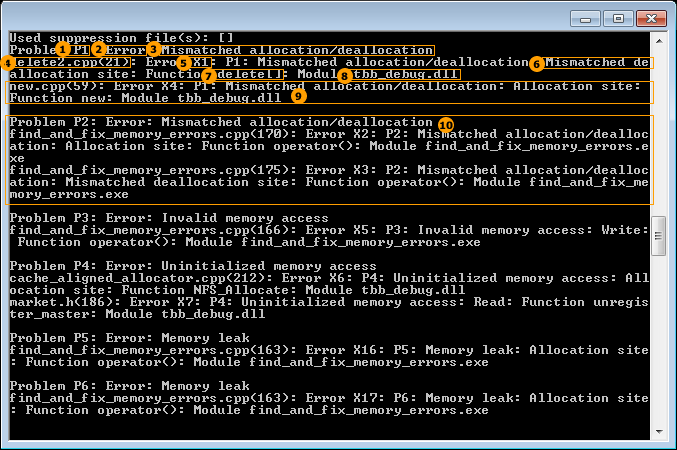
Print to stdout a list of new memory problems found in the myRes007mi2 result:
inspxe-cl-report problems -result-dir myRes007mi2
|
P1 = Unique identifier for a problem set |
|
Error = Severity of the problems in the P1 problem set |
|
Mismatched allocation/deallocation = Problem type of problems in the P1 problem set |
|
delete2.cpp(21) = Source file location and line number of the X1 code location |
|
X1 = Unique identifier for a code location in the P1 problem set |
|
Mismatched deallocation site = Classification of the X1 code location |
|
delete[] = Function name associated with the X1 code location |
|
tbb_debug.dll = Executable or library name associated with the X1 code location |
|
Information for the X4 code location in the P1 problem set |
|
Information for the P2 problem set |
Report Example: Code Locations
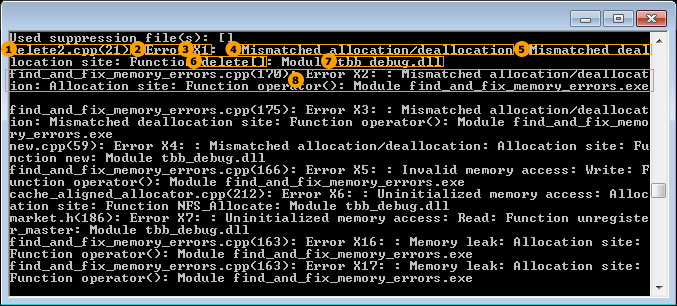
Print to stdout a list of code locations in new memory problems found in the myRes007mi2 result:
$ inspxe-cl -report observations -result-dir myRes007mi2
|
delete2.cpp(21) = Source file and line number of the X1 code location |
|
Error = Severity of the problem containing the X1 code location |
|
X1 = Unique identifier for a code location |
|
Mismatched allocation/deallocation = Problem type of the problem containing the X1 code location |
|
Mismatched deallocation site = Classification of the X1 code location |
|
delete[] = Function name associated with the X1 code location |
|
tbb_debug.dll = Executable or library name associated with the X1 code location |
|
Information for the X2 code location |
Next Step
Use your development environment tools to resolve issues.