A newer version of this document is available. Customers should click here to go to the newest version.
Visible to Intel only — GUID: GUID-80C0599C-0F9F-41E6-A5F1-38876EB9D6AB
Visible to Intel only — GUID: GUID-80C0599C-0F9F-41E6-A5F1-38876EB9D6AB
Graphics Frame Analyzer Window: Open Frame Capture
To access this window, right-click the Graphics Monitor icon  in the taskbar notification area and select Graphics Frame Analyzer. You can also run Graphics Frame Analyzer from the Windows* Start menu or Apps view.
Use this window to open previously captured frame files and streams for profiling. You can preview all the frames and streams available on your host system:
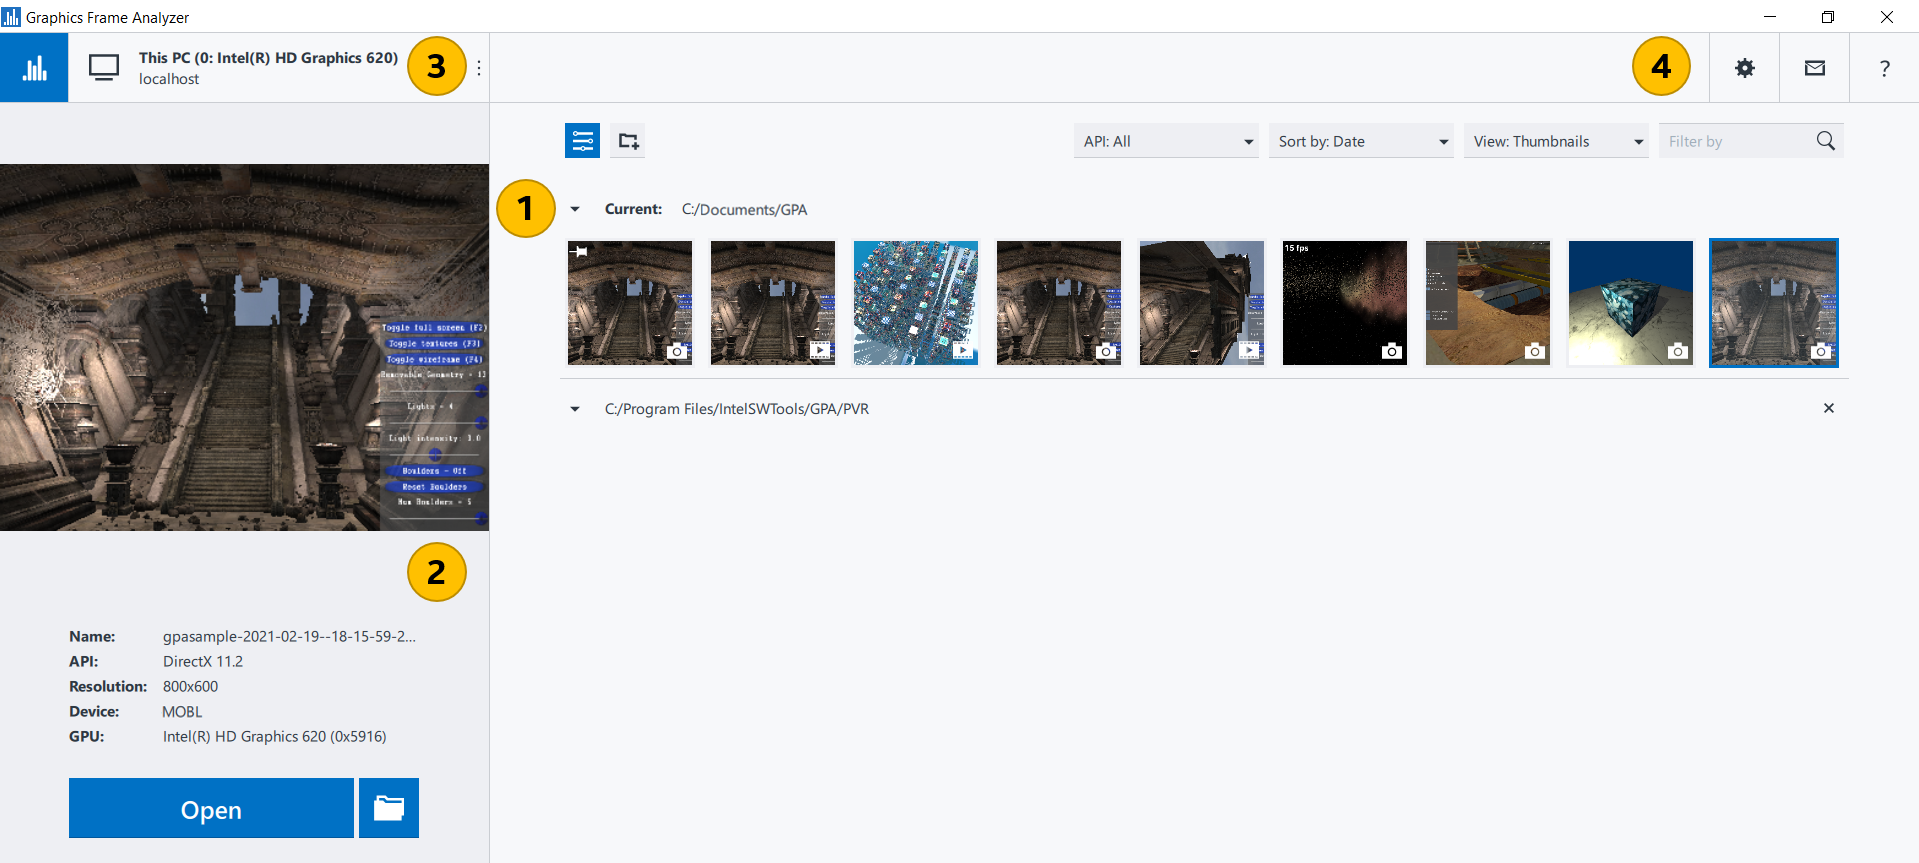
Frame Capture Thumbnails pane Select the capture you want to profile. By default, this field lists all frame and stream captures located in your Intel® GPA home directory %USERPROFILE%\Documents\GPA. You can sort and filter the files by the API type or date using the corresponding buttons or using the Filter by field. If all the capture files on your system are of the same type, the API type tabs are hidden. The currently selected file capture is highlighted with a blue border and appears in the preview pane. Capture file thumbnails are marked with the following icons:
To delete capture files, hover the mouse pointer over a capture file thumbnail and click the Close button in the top right-hand corner of the thumbnail. Confirm your choice by clicking Yes on the thumbnail. You can pin favorite capture files to the top of the list by clicking the Pin button in the top left-hand corner of the thumbnail. |
|
| Preview pane Preview the selected file capture. This field shows the buffer image and the following file capture properties:
If you are trying to open a stream captured on a different GPU or using a different graphics driver version, you will see the warning that it can be a cause of unpredictable playback failure. To rename the selected capture file, you can click its filename and enter a new value. Click Open to open the selected capture file in the Multiframe View window for streams or in the Profiling View window for frames. To open the storage directory of the selected file capture, click the |
|
Choose Target System button
|
|
| Message pane See the Intel® GPA messages or notifications, if there are any. |
Click to capture new frames and streams with Graphics Monitor. |
|
Click to open additional folder with capture files. Capture files from the opened folder are listed under the Current folder. To change the Current folder, change the Capture Files Location in the Graphics Monitor Settings. |
|
| Open button | Open the currently selected capture file to start profiling. |
Open the storage directory of the selected capture file. |
|
Manage Graphics Frame Analyzer settings:
|
|
 Send feedback button Send feedback button |
Open a form to send feedback to the Intel® GPA technical support. |
 Help button Help button |
Open Intel® GPA online documentation. |