Visible to Intel only — GUID: GUID-899A6914-98C2-4825-A23E-0E903707D016
Introducing Application Performance Snapshot
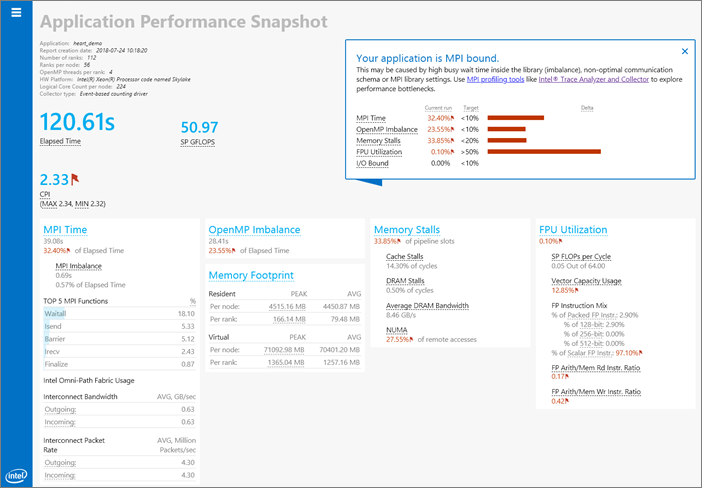
Use Intel® VTune™ Profiler Application Performance Snapshot for a quick view into different aspects of compute intensive applications' performance, such as MPI and OpenMP* usage, CPU utilization, memory access efficiency, vectorization, I/O, and memory footprint. Application Performance Snapshot displays key optimization areas and suggests specialized tools for tuning particular performance aspects, such as Intel VTune Profiler and Intel® Advisor. The tool is designed to be used on large MPI workloads and can help analyze different scalability issues.
Application Performance Snapshot comes bundled with all installations of VTune Profiler on Linux* OS.
Acquire VTune Profiler from one of these locations:
- Standalone VTune Profiler download
- As part of the Intel® oneAPI Base Toolkit
- As part of the Intel® oneAPI System Bring-Up Toolkit
What's New
Updates and improvements to Application Performance Snapshot are posted regularly as part of the VTune Profiler What's New page.