Visible to Intel only — GUID: GUID-576E9DD5-DA8E-46AE-B748-8D812CED2FEC
Function Summary for All Ranks
MPI Time per Rank
Message Sizes Summary for All Ranks
Data Transfers per Rank-to-Rank Communication
Example
Chart Entries
Graphic Representation
Data Transfers per Rank
Data Transfers per Function
Node-to-Node Data Transfers
Communicator List
Detailed Information for Specific Ranks
Visible to Intel only — GUID: GUID-576E9DD5-DA8E-46AE-B748-8D812CED2FEC
Data Transfers per Rank-to-Rank Communication
Key:-x [--transfers-per-communication]
This charts provides information about each rank-to-rank communication. This information can be useful for detecting imbalance in network usage.
Example
| Data Transfers per Rank-to-Rank Communication
|---------------------------------------------------------------------------------------------------
| Rank --> Rank           Time(sec)        Time(%)      Volume(MB)        Volume(%)        Transfers
|---------------------------------------------------------------------------------------------------
  0003 --> 0000            14.30            10.21          8835.73             7.33           370654
  0002 --> 0003            14.15            10.10          8835.73             7.33           370622
  0003 --> 0002            14.04            10.02          8142.73             6.75           336057
  0003 --> 0001            14.02            10.01          7449.73             6.18           301492
  0002 --> 0001            13.92             9.93          8142.73             6.75           336057
  0002 --> 0000            13.89             9.91          7449.73             6.18           301524
  0000 --> 0001            11.61             8.29         19577.18            16.24           847663
  0001 --> 0000            11.39             8.13         17498.20            14.51           809130
  0001 --> 0002             8.41             6.00          8835.72             7.33           370622
  0001 --> 0003             8.14             5.81          7449.73             6.18           301492
  0000 --> 0003             8.13             5.80          9528.71             7.90           337679
  0000 --> 0002             8.10             5.78          8835.72             7.33           303114
|===================================================================================================
| TOTAL                   140.11           100.00        120581.65           100.00          4986106
| AVG                      11.68             8.33         10048.47             8.33           415508
Chart Entries
Columns |
|
|---|---|
Rank <-> Rank |
Numbers of communicating ranks |
Time (sec) |
Communication time between ranks |
Time (%) |
Percent of total time spent in communication |
Volume(MB) |
Amount of data transferred in the communication (in megabytes) |
Volume(%) |
Percentage of amount of data transferred in the communication |
Transfers |
Number of messages in the communication |
Rows |
|
|---|---|
TOTAL |
Total values for all columns |
AVG |
Average values for all columns. The values are calculated as follows: AVG = TOTAL / [(N*N + N)/2], where N is the number of ranks |
Graphic Representation
To generate a graphic representation of rank-to-rank communication, use --format=html. For example:
aps-report -x --format=html <result name>Example
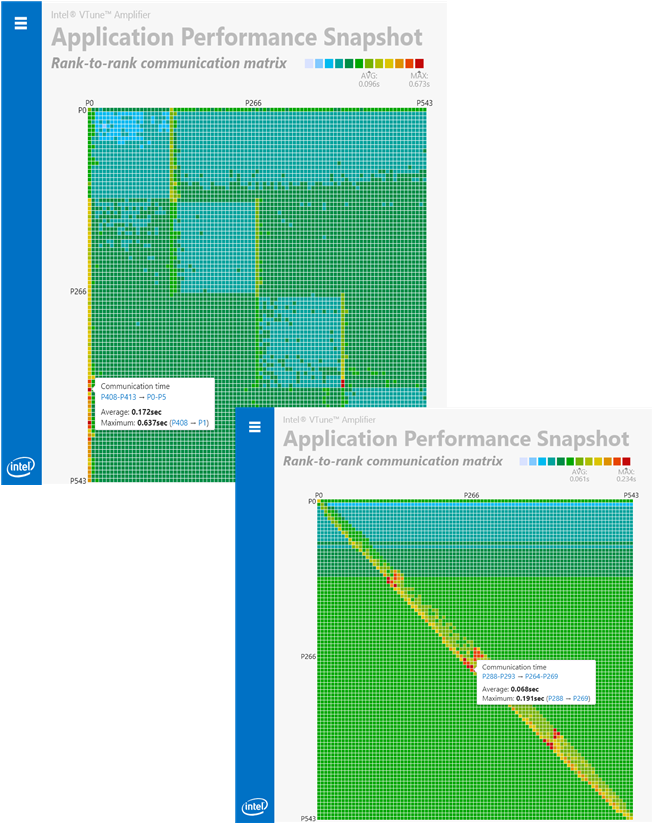
By default, the diagram is generated by communication time. If you need to have communication by volume, add the -v option for the graphic report generation.
You can also use the -X <N> option to specify the size of the diagram. For a given N, the diagram is displayed as a square with the size N by N.
Parent topic: Analysis Charts