Use this document to start using the Intel® Distribution for GDB* for debugging applications. Follow the instructions below to set up the debugger to debug applications with kernels offloaded to CPU and GPU devices.
Intel Distribution for GDB is available as part of the Intel® oneAPI Base Toolkit (Base Kit) or may also be downloaded as standalone component for any other Toolkit installation. For more information on oneAPI toolkits, visit the product page.
Visit the Release Notes page and FAQ pages for information about key capabilities, new features, and known issues.
You can use a SYCL* sample code, Array Transform, to get started with the Intel Distribution for GDB. The sample does not generate errors and simply illustrates debugger features. The code processes elements of the input array depending on whether they are even or odd, and produces an output array. You can use the sample to debug on both the CPU or GPU.
Prerequisites
Install the Intel® oneAPI Base Toolkit for Windows* OS.
Install Microsoft Visual Studio* 2019 or 2022.
NOTE:
Support for Visual Studio* 2017 is removed starting with the Intel® oneAPI 2022.2 release.
Resizable BAR or Smart Access Memory must be enabled for debugging applications using Intel® Arc™ A-Series Graphics. Please follow the instructions to enable the Resizable BAR. For local GPU debugging, the Resizable BAR needs to be enabled on the host machine and for remote GPU debugging, this needs to be enabled on the target machine.
For local GPU debugging, a Windows system with a combination of either an integrated and a discrete GPU, or multiple discrete GPUs is required. The list of supported GPU devices can be found here.
For remote GPU debugging, two Windows systems are required: a host and a target. Visual Studio and oneAPI Base Kit must be installed on the host system. The application is deployed and run on the target system. Install the latest GPU drivers and configure your target system to use them.
To enable Fortran debugging, install, in addition, the Fortran Compiler from the Intel® HPC Toolkit for Windows* OS.
Debug the host part of application locally
You are ready to run your project.
Set breakpoint at the line marked as success in the array-transform.cpp file.
From the Debug menu, select Start Debugging.
Click the Local Windows Debugger menu.
You will see when the thread hits the breakpoint outside the kernel. During this run the default device selector had selected the device to offload the kernel. Usually it is a L0 GPU device, when available.
Debug the host part of application remotely
Here, we assume two system setup:
host system, where Visual Studio and oneAPI toolkits are installed;
target system, where the application is deployed and run.
Setup the target system
Make sure that runtime dependencies on shared libraries from Intel® oneAPI Toolkits are available on the target system. You can do this by Installing run-time dependencies and selecting Intel® oneAPI DPC++/C++ Compiler Runtime for Windows* from the list of runtime dependencies. For Fortran remote debugging, select Intel® Fortran Compiler Runtime for Windows*.
Install Microsoft Visual Studio remote debugger based on the version of Visual Studio installed on your host machine. To learn more about Microsoft Visual Studio remote debugger, refer to Microsoft documentation.
Prepare a project for debugging remotely
Follow the steps below to set up the remote debugging session for the Array Transform sample:
Open Array Transform Properties. You need Properties window to complete all of the next steps in this section.
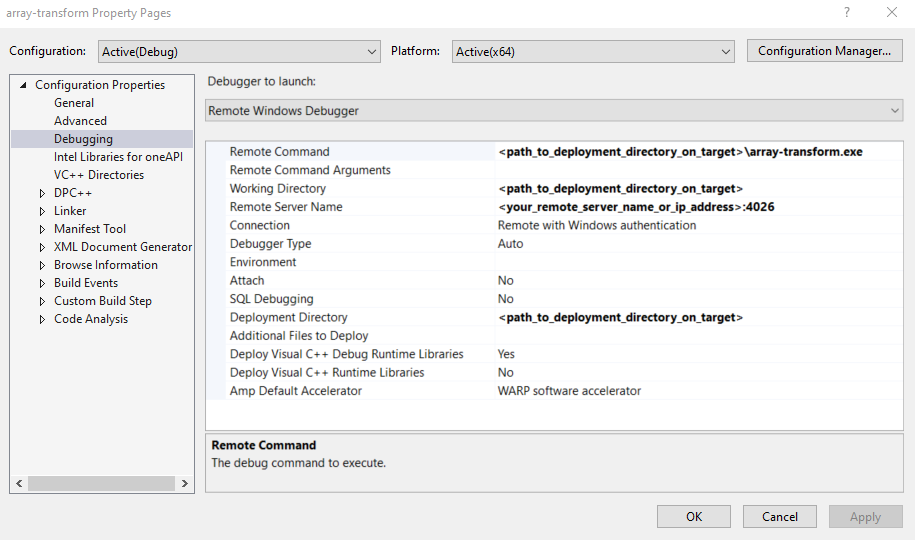
For remote debug: under Configuration Properties select Debugging.
From the Debugger to launch drop-down menu, select Remote Windows* Debugger.
For Remote Command, specify the path to the deployment directory on the target system. For example, C:\deploy\array-transform.exe.
Set Working Directory to the path to the deployment directory on the target system.
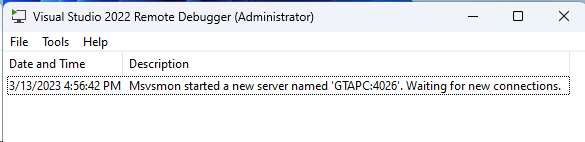
Update Remote Server Name using the remote debugger name from the target system, including the port number. The default port used by the Microsoft Visual Studio 2022 Remote Debugger server is 4026.
NOTE:
You can get the Remote Server name from the window that appears on the target system when you start the Remote Debugger.
Set Deployment Directory to the path to the deployment directory on the target system.
The directory will be created on the target system and the array-transform executable file will be copied to this location.
NOTE:
Remote Command,
Working Directory, and
Deployment Directory fields must point to the same path.
Click the Apply button to set your changes.
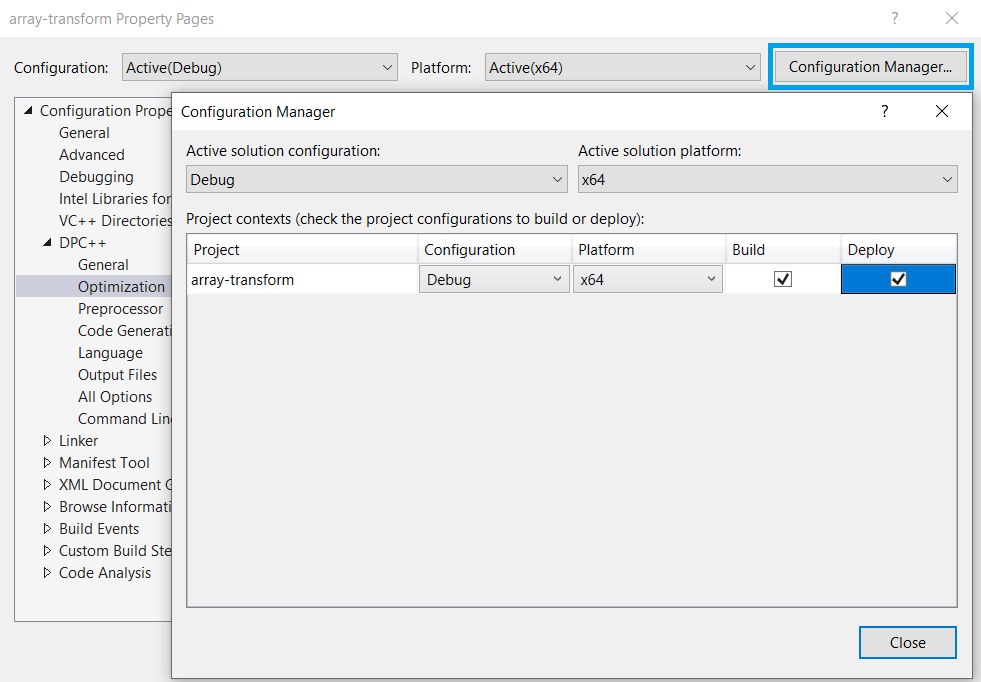
Click the Configuration Manager in the upper right corner of the Properties window and mark the Deploy check box. Close the Property Pages.
NOTE:
The
Deploy check box is disabled until the
Deployment Directory is specified.
Debug the sample with the breakpoint outside the kernel
To verify the remote debugger setup, start the debugging with the breakpoint outside the kernel:
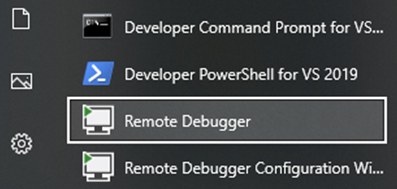
On the target system, start the remote debugger by clicking the Remote Debugger in the Start menu.
On the host system, return to your project and set a breakpoint outside the kernel offloaded to the GPU. For example, at line marked as success of the array-transform.cpp file.
To start debugging, on the Debug toolbar, click  Remote Windows Debugger button.
NOTE:
You may be prompted to log in to the target system. Be sure that credentials are set for the target system.
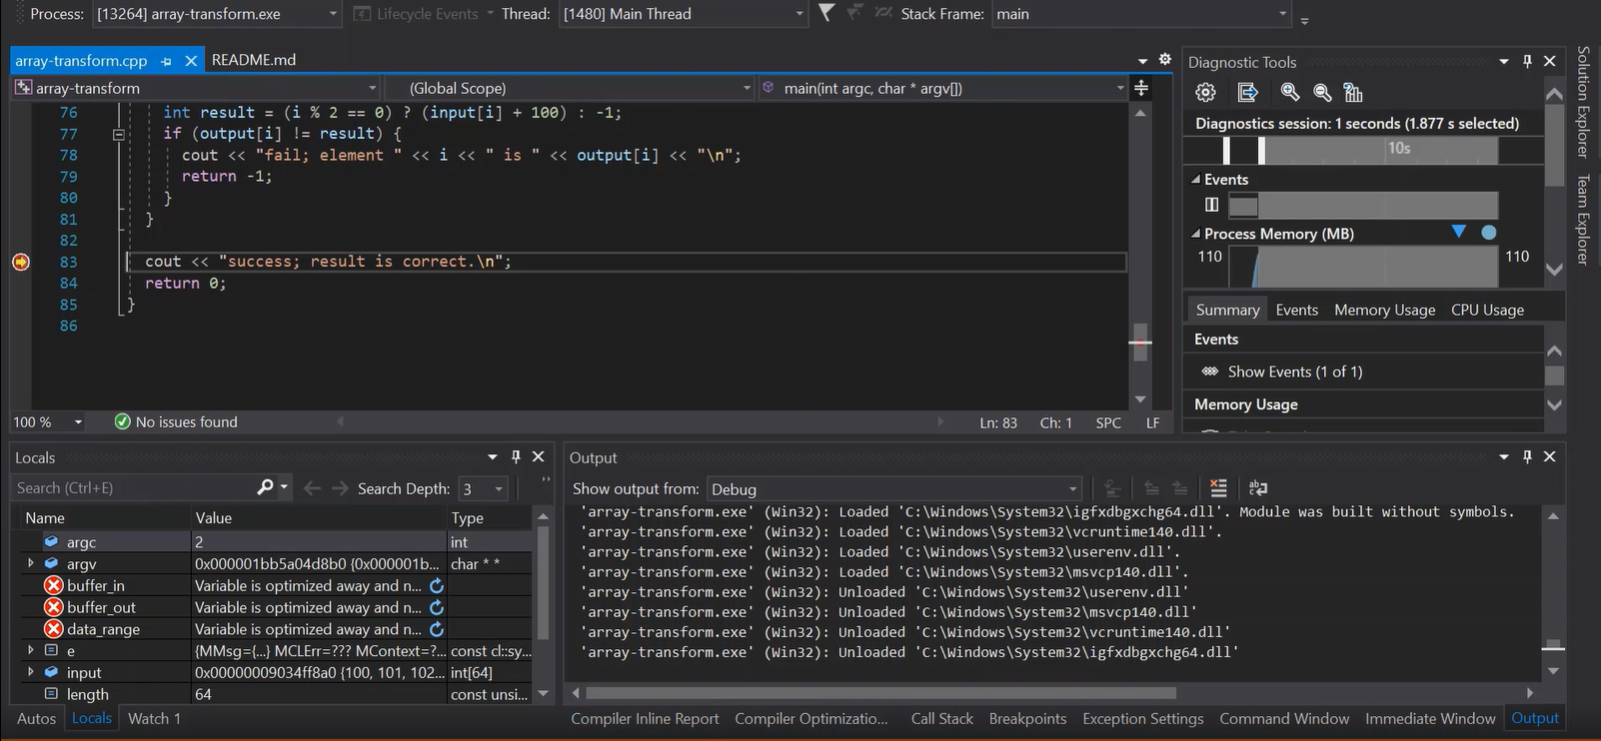
When the debugger hits the breakpoint, the example Visual Studio output is as follows:
Your application will launch on the target system. The offloading will happen to the default device or the device specified by ONEAPI_DEVICE_SELECTOR. The example output of the Remote Windows Debugger on the target system is as follows:
[SYCL] Using device: [Intel(R) Arc(TM) A770 Graphics] from [Intel(R) Level-Zero]
Such output indicates that you set up the remote debugger successfully and the default L0 GPU device was used for offloading.
Quit the debugger by clicking the  button.
Get Started with Debugging a Kernel on CPU
Configure application to offload on CPU
In the Solution Explorer, right-click the array-transform project and select Properties. Alternatively, press Alt+Enter.
Under Configuration Properties, select Debugging. For the debugger you intend to use (Local Windows Debugger or Remote Windows Debugger), edit the Environment field such that the value of the ONEAPI_DEVICE_SELECTOR environment variable is set to *:cpu.
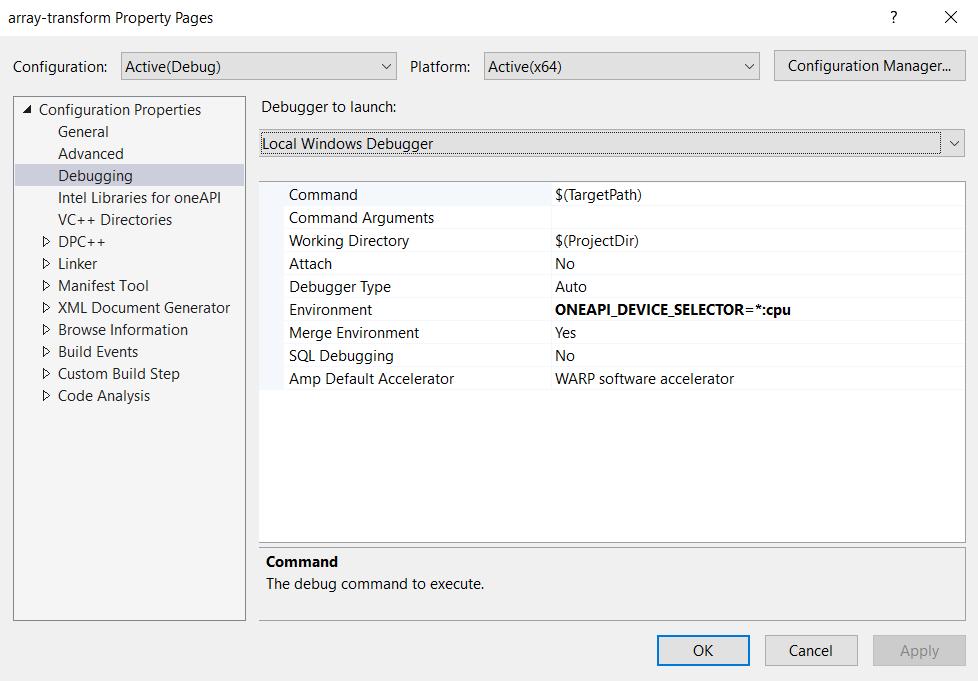
For more details about the device selection, please refer to Compiler Environment Variables.
Debug kernel offloaded to CPU locally
You are ready to debug your project.
Set breakpoint at line marked as breakpoint-here in the array-transform.cpp file.
From the Debug menu, select Start Debugging.
Click the Local Windows Debugger menu.
You will see when the thread hits the breakpoint.
Refer to the tutorial to learn more about using Intel Distribution for GDB.
Debug kernel offloaded to CPU remotely
By now, if you tried to set a breakpoint inside the kernel offloaded to CPU and used the Remote Windows Debugger, the breakpoint was not hit. The reason is that the kernel’s .PDB file is located on the remote machine and Visual Studio cannot find it. To fix that additionally to the settings described in Debug the Host Part of Application Remotely, do the following:
On target system make the directory %USERPROFILE%\AppData\Local\Temp accessible by Visual Studio, such that it could load kernel debug symbols.
On the target system, go to %USERPROFILE%\AppData\Local\Temp and open its properties.
Go to the Sharing tab and click Share. A new window pops up. By default, the sharing is configured for the current user.
Click Share button on the bottom of the window to share the folder for the selected users.
Copy the network path of the shared folder.
Check that the folder is accessible on your host system by its network path.
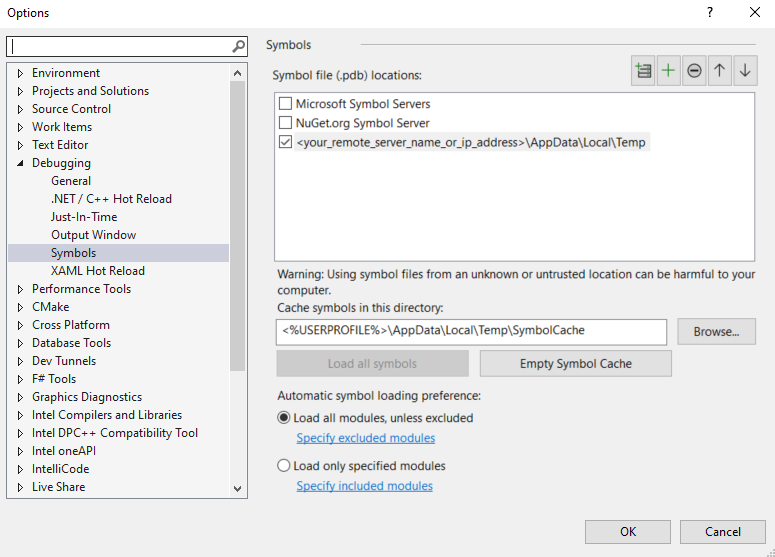
When the folder is available, on the host machine in Visual Studio, go to Tools > Options > Debugging > Symbols. Click a plus-icon to add a new location, from where Visual Studio loads debug symbols, and type the network path of the shared folder there.
With the above setting, the breakpoint inside the kernel offloaded to a CPU device should be hit with the Remote Windows Debugger.
Get started with debugging a kernel on GPU
High-level steps
Choose between local and remote debugging and hit a breakpoint outside of the kernel.
Configure target system.
Prepare an application for debugging using the oneAPI plugin of Microsoft Visual Studio.
Configure Intel Distribution for GDB.
Start the debugging session, which will deploy and run the application on the target system.
Investigate the program state using standard Visual Studio debugging user interface. Additionally, Intel Distribution for GDB provides the oneAPI GPU threads view.
Choose between local and remote debugging
Debugging the kernel offloaded to a GPU device halts the GPU device on which the kernel is offloaded. If the display is also using the same GPU, it will be frozen. When you have multiple GPUs on your system, you can debug locally. Typically, one GPU (often an integrated one) is dedicated to displaying, while the remaining GPUs can be utilized for computation and debugging if they are supported by the debugger. In that case you can use the local debugger.
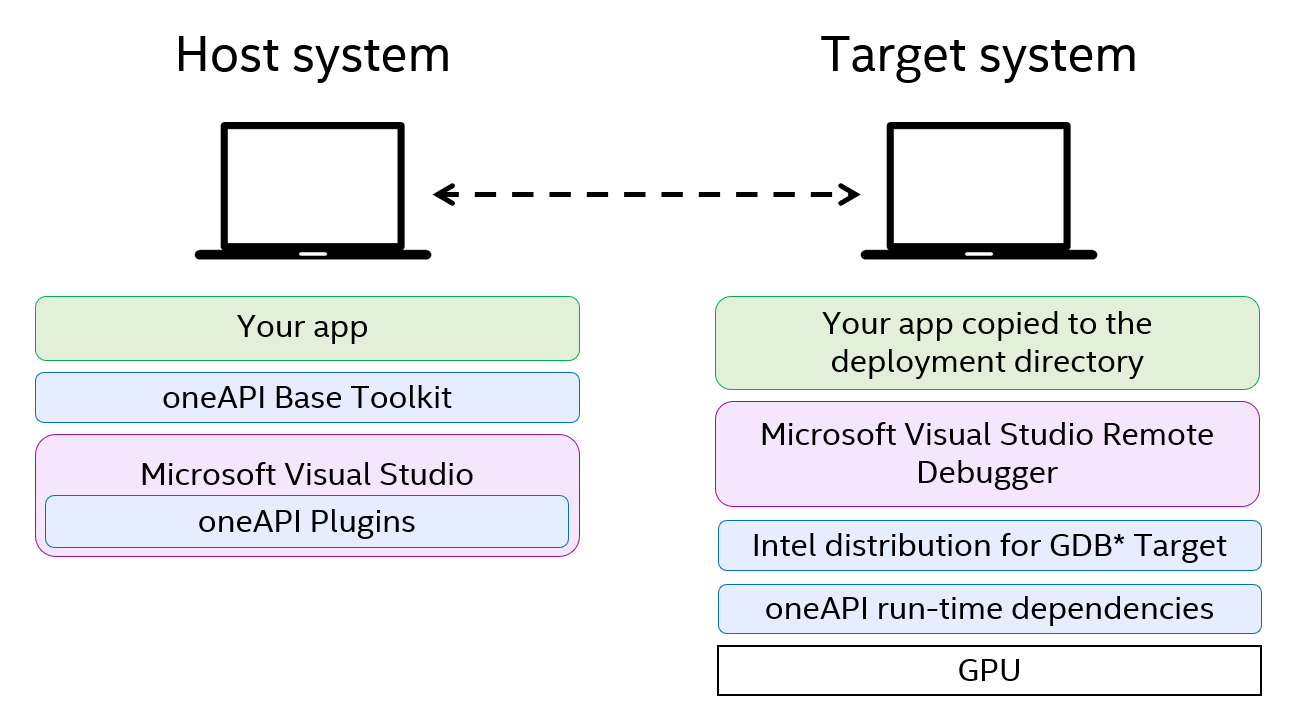
If your target system, where you plan to run the application offloading to a GPU, has just one GPU device and this GPU is supported by the debugger, you can debug the kernel only with the remote debugger. The high-level setup of the remote system looks as following:
Before you proceed, please check that you can hit a breakoint outside of the kernel with the choosen debugger:
Configure the target system
For debugging kernels offloaded to GPU, Intel Distribution for GDB target installer (gen_debugger_target.msi) has to be installed on the machine, where the application will run.
[only for remote debugging] If you intend to debug remotely, copy the target installer of Intel Distribution for GDB (gen_debugger_target.msi) from the host system to the target.
The installer is located on the host machine at %ProgramFiles(x86)%\Intel\oneAPI\debugger\latest\opt\debugger\target.
Run the installer on host for local debugging or on target for the remote debugging. While installing, select the checkbox under “Additional Installer Task” to set the TdrDelay to the default value of 300 seconds.
NOTE:
The installer sets the following registry keys to 300 seconds:
This setting specifies the number of seconds that the GPU can delay the preempt request from the GPU scheduler. This is effectively the timeout threshold.
Without this setting, the debugger will not work properly. The stop at a breakpoint triggers the timeout detection and recovery (TDR) mechanism on Windows, which we need to delay in order to investigate the state where the debugger has stopped the kernel.
OS will not be able to recover automatically if the GPU stops responding while producing a graphics output. Ideally, install the remote debugger only on computing GPUs.
Set Up Intel Distribution for GDB with enhanced GPU offload
In Visual Studio configure Intel(R) Distribution for GDB* extension.
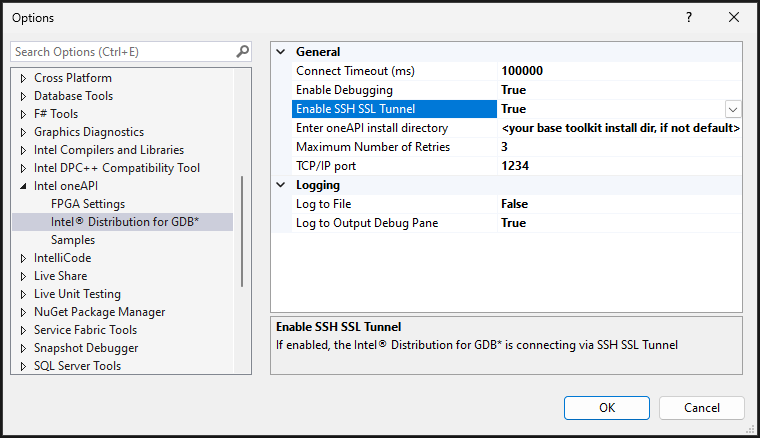
Open Tools > Options > Intel® oneAPI > Intel® Distribution for GDB*.
Set Enable Debugging to True.
(Optional for Remote Debugging) Enable secure connection to the remote target by setting Enable SSH SSL Tunnel to True.
If this option is enabled, you will be asked to enter user credentials while connecting to the remote target system. You can also change the Maximum Number of Retries to control how many times a user can re-enter credentials.
NOTE:
Security of the SSH configuration defines security of your system. See the
NIST SSH guidelines on setting a strong password.
Enter the oneAPI base toolkit install directory that was chosen during installation. Leave this field blank if the oneAPI base toolkit was installed in the default location.
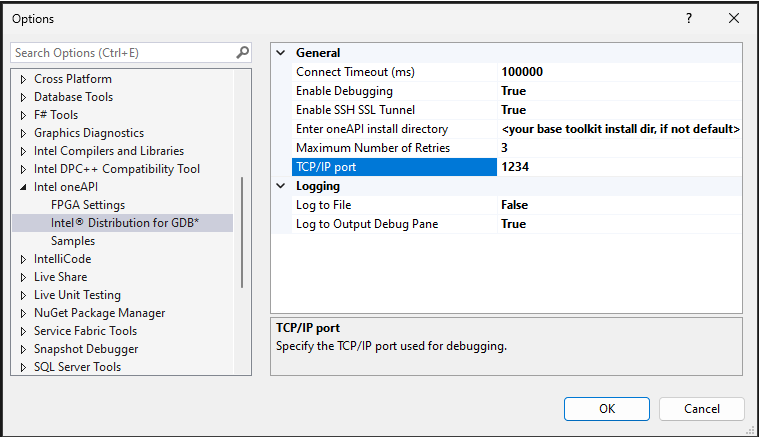
Set TCP/IP port to the port number used when running gdbserver-ze. The default is 1234.
NOTE:
The TCP/IP port must differ from the port number used by Microsoft Visual Studio remote debugger.
Click OK to save the changes.
Configure and debug the application
The further setup procedure depends on whether you want to debug a program following SYCL or OpenMP™ standards. For remote debugging, configure your systems as described in the following sections:
Prepare to debug a SYCL kernel on a GPU
If not yet done, configure and build the application.
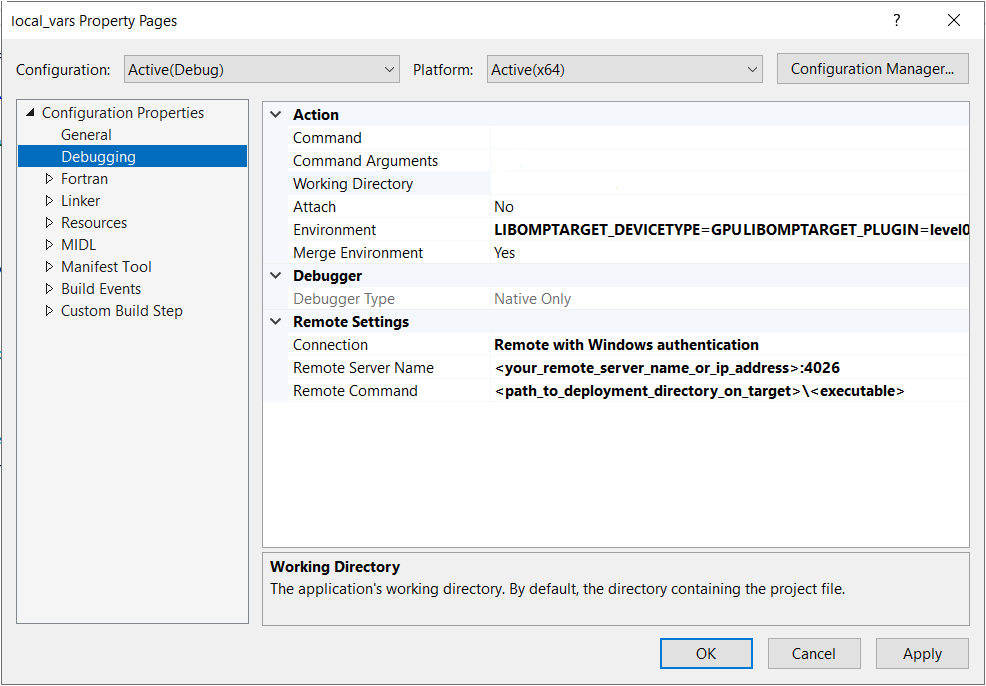
Go to Project Property pages and under Configuration Properties select Debugging.
From the Debugger to launch drop-down menu, select the debugger you wish to use: Local Windows* Debugger or Remote Windows* Debugger.
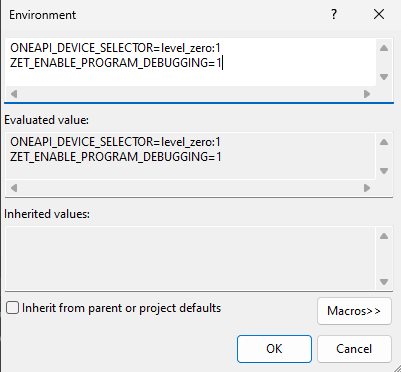
Edit the Environment field such that the value of the ONEAPI_DEVICE_SELECTOR environment variable is set to level_zero:gpu. Also, add the environment variable ZET_ENABLE_PROGRAM_DEBUGGING and set it’s value to 1.
NOTE:
When there are multiple GPUs on the target machine you are debugging, you need to find the device number of the GPU using the commmand
sycl-ls in the command prompt of the target. Since debugging is supported only on Intel® Arc™ Series GPUs, make sure you select the device number associated with these discrete GPUs.
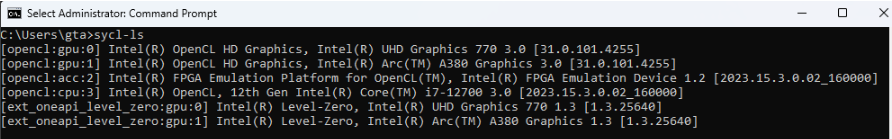
Once you have identified the device number, you will have to specify this in the Environment field such that the value of the ONEAPI_DEVICE_SELECTOR environment variable is set to level_zero:<device_number>. 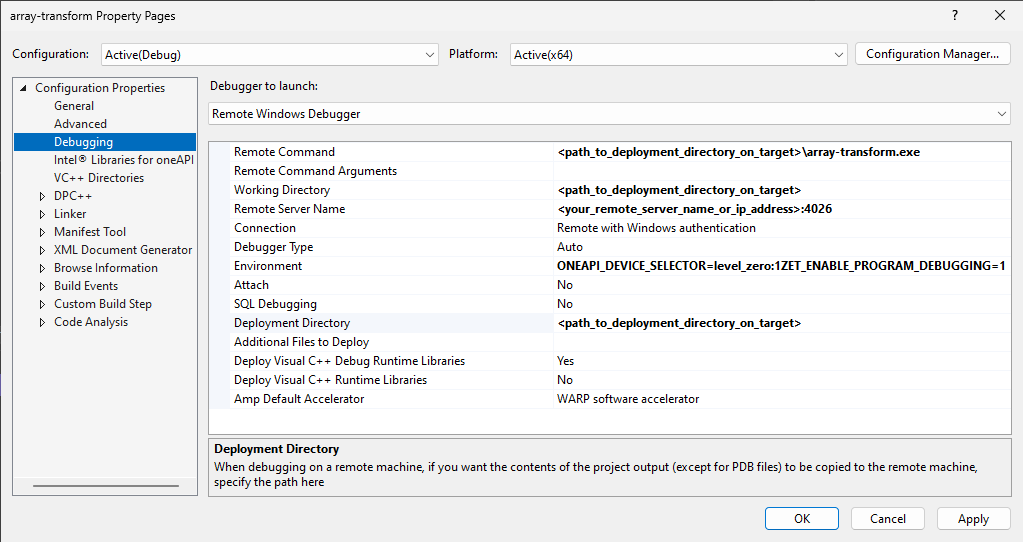
Prepare to debug an OpenMP kernel on a GPU
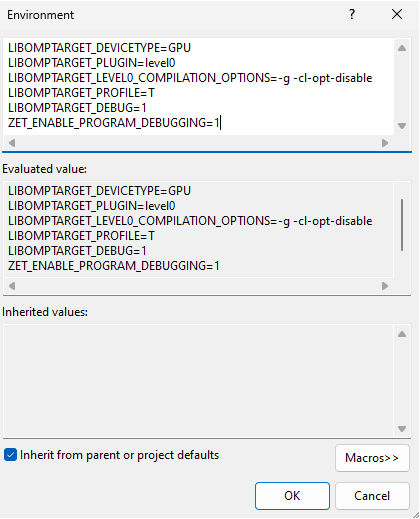
To debug an OpenMP project, set environment variables as follows:
Set device type to GPU:
LIBOMPTARGET_DEVICETYPE=GPU
Choose level0 as an offload target:
LIBOMPTARGET_PLUGIN=level0
Configure flags for the backend compiler.
For level0:
LIBOMPTARGET_LEVEL0_COMPILATION_OPTIONS=-g -cl-opt-disable
(Optional) Print offload profile information at the end of offload:
LIBOMPTARGET_PROFILE=T
(Optional) Print OpenMP library debug traces:
LIBOMPTARGET_DEBUG=1
Set the environment variable to enable program debugging:
ZET_ENABLE_PROGRAM_DEBUGGING=1
To prepare a project for debugging, do the following:
Create a new SYCL Console App project.
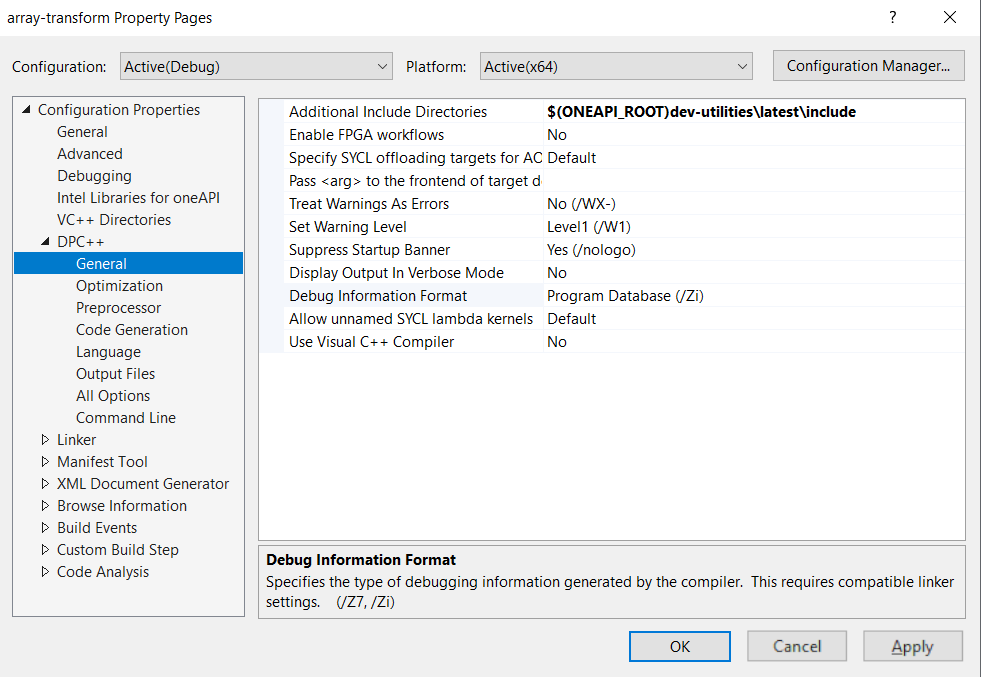
Set Property Pages > General > Platform Toolset to Intel(R) oneAPI DPC++ Compiler 2023. Press Apply.
Set Property Pages > Debugging > Environment as shown above.
Set Property Pages > DPC++ > Language > OpenMP Support to Generate Parallel Code (/Qiopenmp).
Set Property Pages > DPC++ > Language > Enable OpenMP Offloading to Generate x86 + SPIR64 fat binary (/Qopenmp-targets:spir64).
Add your code and compile the application.
To prepare a Fortran project for debugging, do the following:
Make sure you have installed:
on the host system, the Fortran Compiler from the Intel® HPC Toolkit for Windows* OS.
on the target system, the Intel® Fortran Compiler Runtime for Windows* from the Intel® oneAPI standalone component installation files.
Create a new Fortran project.
Set Property Pages > General > Use Compiler to IFX Intel(R) Fortran Compiler. Press Apply.
Set Property Pages > Debugging > Environment as shown above.
Set Property Pages > Fortran > Code Generation > Enable OpenMP Offloading to Generate x86 + SPIR64 fat binary (/Qopenmp-targets:spir64).
Set Property Pages > Fortran > Language > Process OpenMP Directives to Generate Parallel Code (/Qopenmp).
Set Property Pages > Fortran > Language > OpenMP Support to Generate Parallel Code (/Qiopenmp).
Add your code and compile the application.
Copy your executable to the deployment directory on your target system.
Under Property Pages select Debugging.
From the Connection drop-down menu, select Remote with Windows authentication
Update Remote Server Name using the remote debugger name from the target system, including the port number. The default port used by the Microsoft Visual Studio 2022 Remote Debugger server is 4026.
For Remote Command, specify the path to the deployment directory on the target system. For example, C:\deploy\local_vars.exe.
Build and debug the sample
To build the solution, select Build > Build Solution in the main Visual Studio toolbar. In the Output window, verify that the build is successful.
Now you are ready to debug your project with the kernel offloaded to the GPU. Follow the steps in the tutorial to start the debugging.