Major steps to gather a system diagnostic file for issue investigation and troubleshooting:
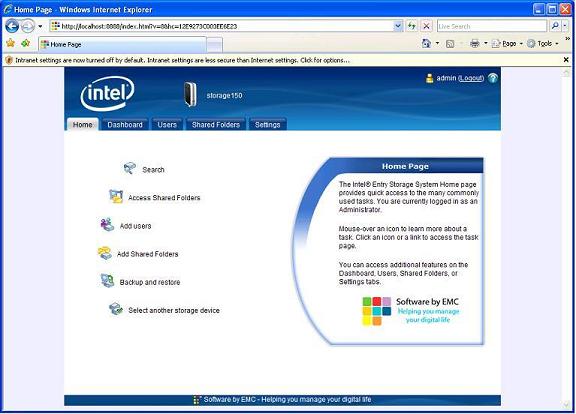
- Open the Intel® Entry Storage System manager and login if necessary
- Navigate to the support.html web address
- Open the Dump Files applet
- Create a diagnostic dump file
- Download and save to the local computer
- View diagnostic dump using a web browser
- Helpful diagnostic location descriptions
Detailed steps to gather a system diagnostic file for issue investigation and troubleshooting:
-
Open the Intel® Entry Storage System manager and login if necessary:
-
Select the Settings tab and replace settings.html: in the browser address bar with support.html:

-
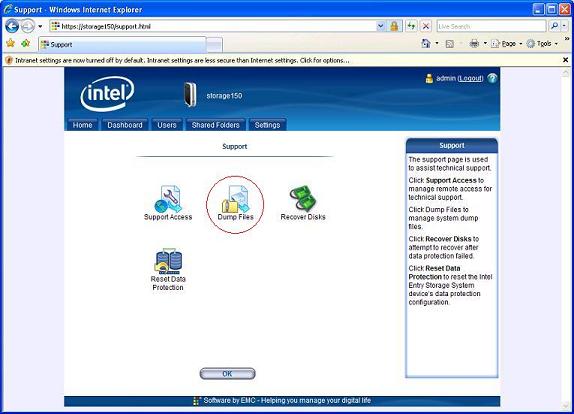
When the support configuration page appears, select Dump Files:
-
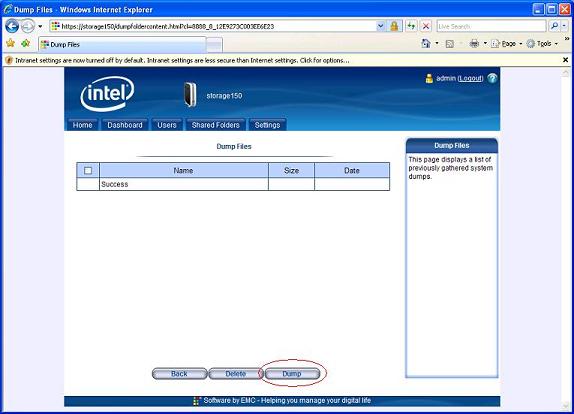
Select Dump to create a new dump file with the most recent information. Diagnostic dump files are created on demand by pressing the Dump button:
-
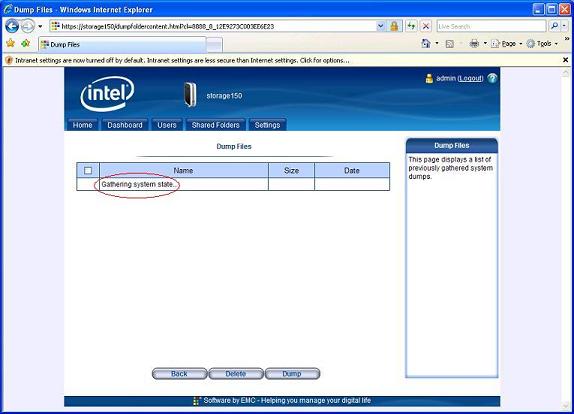
System state information is gathered from the storage system. This can take up to a minute or two with no indication except for the Gathering system state indicator:
-
-
The new Dump file appears. Double-click the new Dump file and save it to the local hard disk:
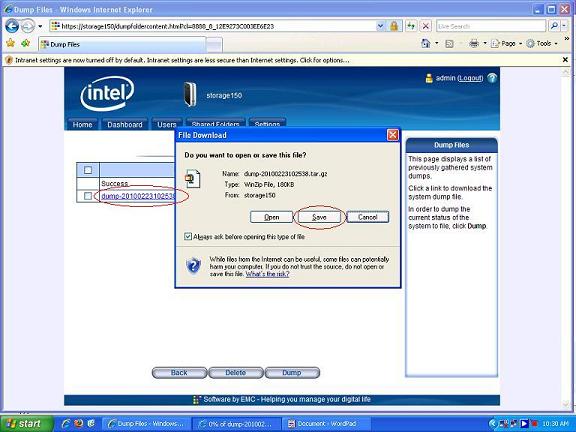
The dump file is saved as a tar.gz compressed file. Decompress to make the diagnostic dump file folder available for viewing.
-
Open the diagnostic dump file folder:
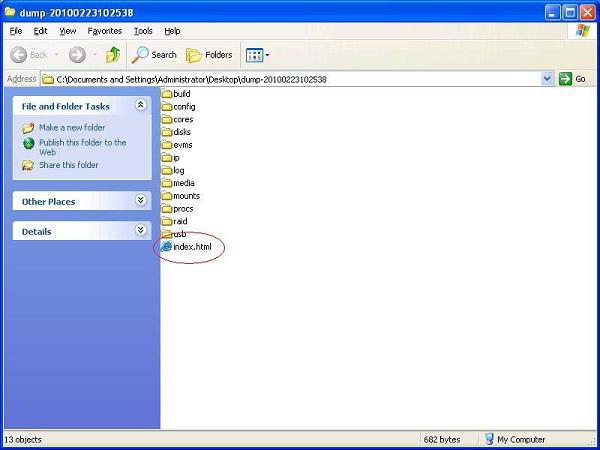
You can view the resulting Dump files through a web browser. Double-click the parent directory index.html file to view the subfolder information.-
The Dump file folders are available as hyperlinks:
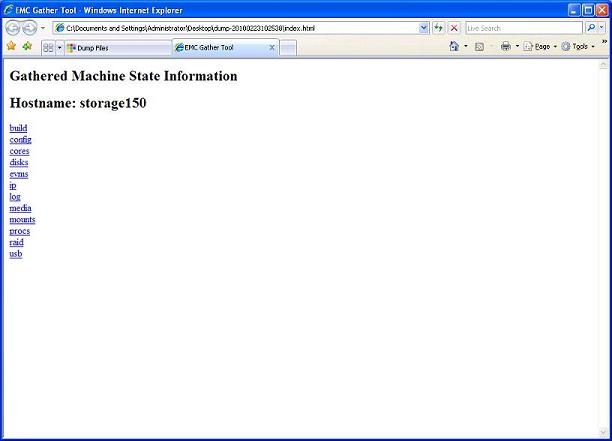
Files within these folders are also hyperlinks and can be viewed within the browser. You may be required to specify the application to open specific file types (.log, .conf, .d...). These are Linux-based file types. For the most part, WordPad* is generally recommended to maintain readable formatting.
-
-
Helpful locations to check for issue troubleshooting:
config/etc
sohoFlash.xml - Contains current firmware, storage system name, and time zone information.
disks
sdx.info – Disk x information. Disks are designated as a, b, c, or d
Installed USB drives will appear here as sd?.info and so on following HDDs
ip
ifconfig.out – System network adapter configuration. ifconfig command output
log
messages – System messages log file in chronological event order
soho.log – Log file for general storage device events
sohoaudit.log - Log file for storage device audit events
mounts
index.html - Mount point information from Linux df and mount commands
procs
top.out - List of processes using the largest amount of system CPU time or memory at the time the dump file was created
raid
md0.out - RAID Information from mdadm and mdstat command
usb
index.html - Detailed information on USB devices. For additional USB Disk information see the disks output