Get Started with Intel® VTune™ Profiler
Use Intel VTune Profiler to analyze local and remote target systems from Windows*, macOS*, and Linux* hosts. Improve application and system performance through these operations:
- Analyze algorithm choices.
- Find serial and parallel code bottlenecks.
- Understand where and how your application can benefit from available hardware resources.
- Speed up the execution of your application.
Download Intel VTune Profiler to your system through one of these ways:
- Download the Standalone version.
- Get Intel VTune Profiler as part of the Intel® oneAPI Base Toolkit.
See the VTune Profiler training page for videos, webinars, and more material to help you get started.
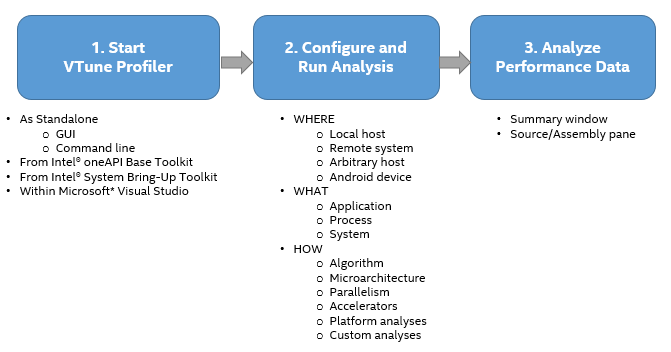
Understand the Workflow
Use Intel VTune Profiler to profile an application and analyze results for performance improvements. The general workflow contains these steps:
Select Your Host System to Get Started
Learn more about system-specific workflows for Windows*or Linux* systems.


NOTE:
Intel VTune Profiler does not operate on macOS* systems. To use Intel VTune Profiler or view analysis results on a macOS system, consider using Intel VTune Profiler Server.