Scheduling Overhead in an Intel® oneAPI Threading Building Blocks Application
Detect and fix scheduling overhead in an Intel® oneAPI Threading Building Blocks (oneTBB) application.
Content expert: Jennifer Dimatteo
During dynamic distribution of fine-grain chunks of work between threads, you can encounter scheduling overhead. When this happens, parallelism can be inefficient due to two reasons:
- The scheduler takes a significant amount of time to assign work for working threads.
- Working threads spend a lot of time waiting to receive new chunks of work.
In extreme cases, the threaded version of a program can actually be slower than the sequential version. The majority of oneTBB constructs use a default auto-partitioner. To avoid overhead, the auto-partitioner tailors the number of chunks larger than the default grain size.
If you use a simple partitioner either intentionally or with constructs like parallel_deterministic_reduce, you should take care of a grain size. A simple partitioner divides the work into chunk sizes up to the default grain size of one iteration.
In this recipe, learn how to use Intel® VTune™ Profiler to detect scheduling overhead in a oneTBB application. The profiling results also give advice on increasing the grain size to avoid an associated slowdown.
Ingredients
This section lists the hardware and software tools used for the performance analysis scenario.
Application: A sample application that calculates the sum of vector elements using the oneTBB parallel_deterministic_reduce template function.
Compiler : Intel® Compiler or GNU* compiler with compiler/linker options, for example:
icpx -I <tbb_install_dir>/include -g -O2 -std=c++17 -o vector-reduce vector-reduce.cpp -L <tbb_install_dir>/lib/intel64/gcc4.8 -ltbb
Performance analysis tools:VTune Profiler - Threading analysis
Operating system: Ubuntu* 16.04 LTS
CPU: Intel Xeon® CPU E5-2699 v4 @ 2.20GHz
Create a Baseline
The initial version of the sample code uses parallel_deterministic_reduce with the default grain size (line 17-23):
#include <stdlib.h>
#include "tbb/tbb.h"

static const size_t SIZE = 50*1000*1000;
double v[SIZE];

using namespace tbb;

void VectorInit( double *v, size_t n )
{
    parallel_for( size_t( 0 ), n, size_t( 1 ), [=](size_t i){ v[i] = i * 2; } );
}

double VectorReduction( double *v, size_t n )
{

    return parallel_deterministic_reduce(
        blocked_range<double*>( v, v + n ),
        0.f,
        [](const blocked_range<double*>& r, double value)->double {
            return std::accumulate(r.begin(), r.end(), value);
        },
        std::plus<double>()
    );
}

int main(int argc, char *argv[])
{
    task_scheduler_init( task_scheduler_init::automatic );

    VectorInit( v, SIZE );

    double sum;

    for (int i=0; i<100; i++)
		  sum = VectorReduction( v, SIZE );

    return 0;
}
To make compute work more significant and measurable for statistical analysis, the vector sum calculation is repeated in the loop in line 35 .
Running the compiled application takes about 9 seconds. This is a performance baseline that you use for further optimizations.
Run Threading Analysis
To estimate threading parallelism in your application and the time spent on scheduling overhead, run the Threading analysis in VTune Profiler:
Click the
 New Project button on the toolbar and specify a name for the new project, for example: vector-reduce.
 Click Create Project.
The Configure Analysis window opens.
On the WHERE pane, select the Local Host target system type.
On the WHAT pane, select the Launch Application target type and specify an application for analysis.
On the HOW pane, click the browse button and select Parallelism > Threading analysis.
Click the
 Start button.
VTune Profiler runs the application and collects data. Once data collection is finalized, the symbol information is resolved. This is necessary for successful source analysis.
Since the analysis is based on instrumentation and uses a stack stitching technology, the elapsed time of the instrumented application can be slower than the original application run because of the collection overhead.
Identify Scheduling Overhead
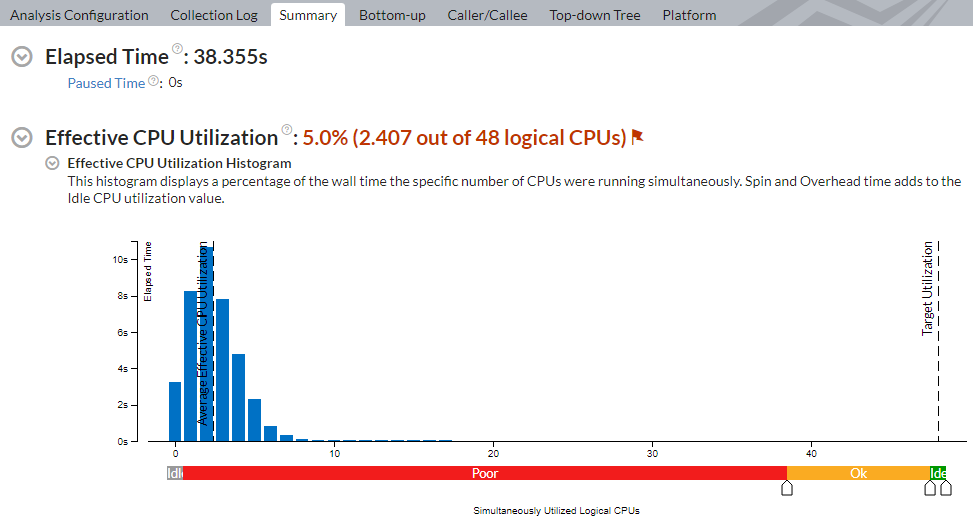
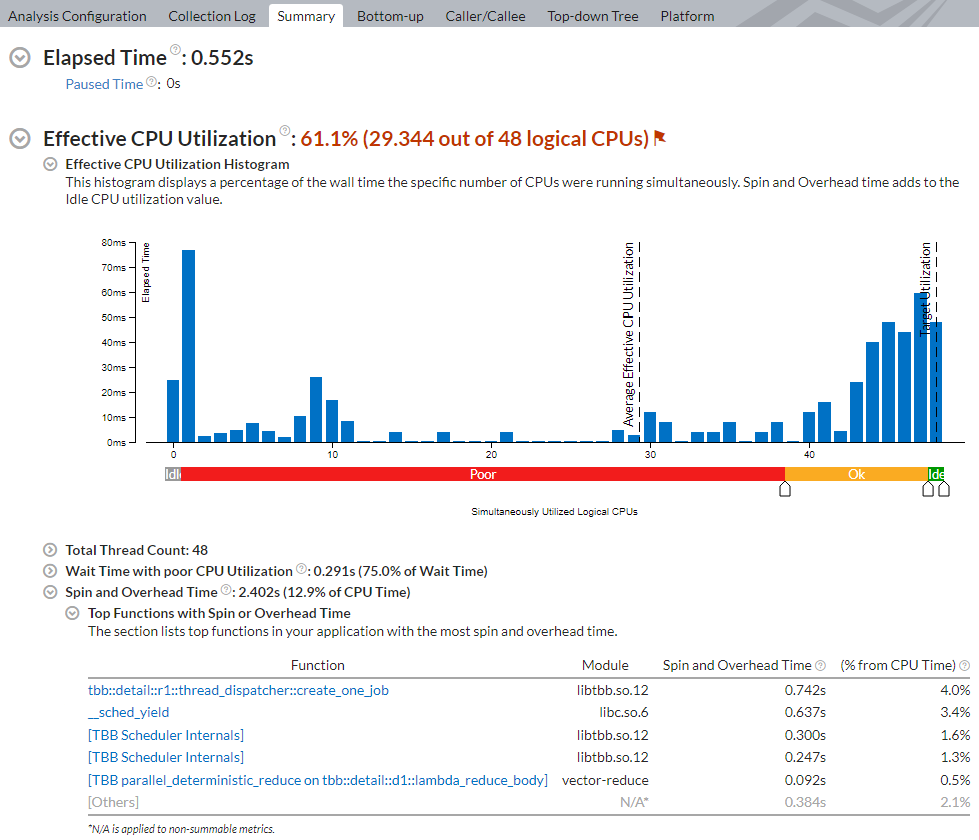
Start your analysis with the Summary view that displays application-level statistics.
The Effective CPU Utilization Histogram shows that, on average, the application utilized only ~3 physical cores out of 48 available cores:
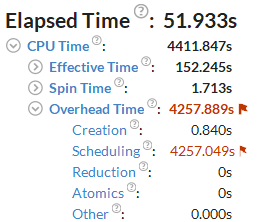
Flagged Overhead Time metric and the Scheduling sub-metric signal a threading inefficiency problem that should be explored:
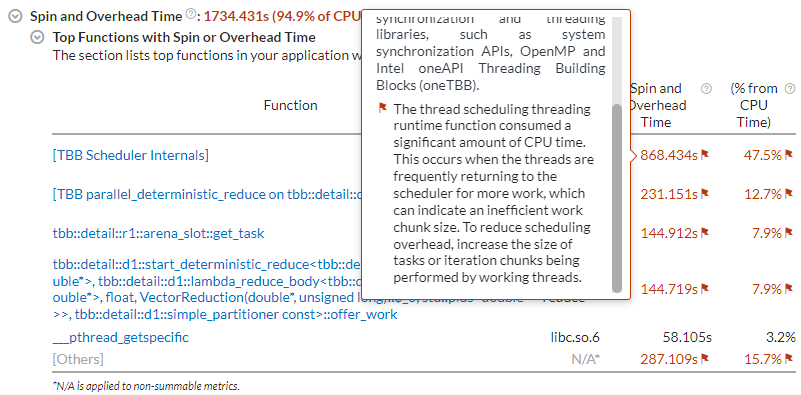
The Spin and Overhead Time section shows [TBB Scheduler Internals] as the main time-consuming function. The hint on the flag associated with the function informs about scheduling overhead that should be addressed by increasing a grain size of parallel work:
The sample application contains two oneTBB constructs:
- parallel_for initialization
- parallel_deterministic_reduce to calculate the sum of vector elements
Expand the CPU Time > Overhead Time columns to sort the grid by the Scheduling column. Look at the first row with the oneTBB parallel construct in the Function list:
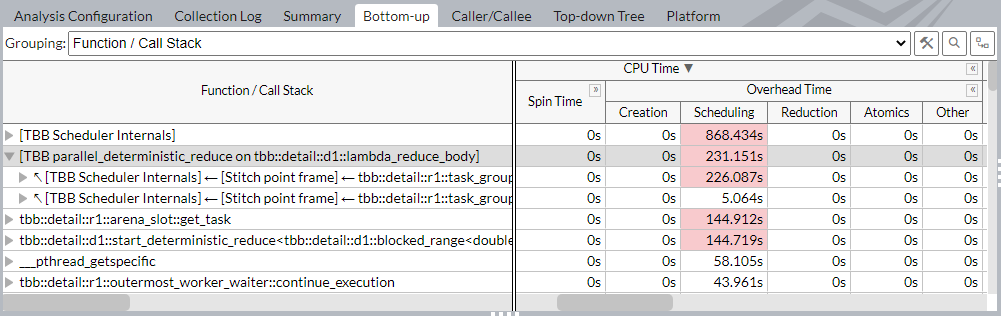
This row points to the parallel_deterministic_reduce construct in the VectorReduction function that has the highest scheduling overhead. Try to make work chunks more coarse-grain to eliminate the overhead in parallelization with this construct.
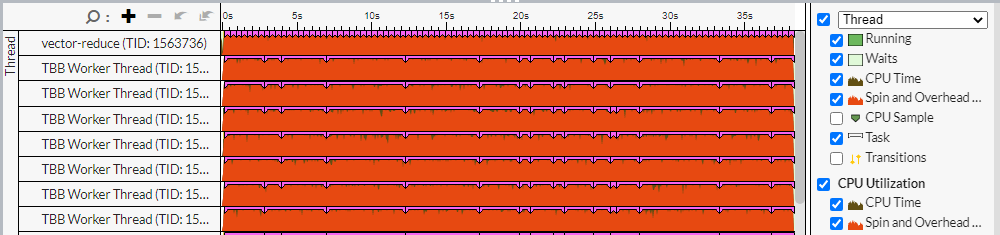
To better visualize the imbalance during the application run, use the Timeline view. The brown sections show useful work and the red sections show where time was wasted.
Increase Grain Size of Parallel Work
The fine-grain chunks of work which were assigned to worker threads cannot compensate the time spent by the scheduler on the work assignment. The default chunk size for parallel_deterministic_reduce that uses a simple partitioner is 1. This means that worker threads will take just one loop iteration to execute before turning back to the scheduler for a new portion of work. Consider increasing the minimal chunk size to 10000 (line 5 in the snippet below):
double VectorReduction( double *v, size_t n )
{

    return parallel_deterministic_reduce(
        blocked_range<double*>( v, v + n, 10000 ),
        0.f,
        [](const blocked_range<double*>& r, double value)->double {
            return std::accumulate(r.begin(), r.end(), value);
        },
        std::plus<double>()
    );
}
Repeat the Threading analysis:
You see that the elapsed time of the application has significantly reduced.
- The average effective CPU utilization is ~29 logical cores. This is because the metric counts a warmup phase. In the compute phase, CPU utilization is closer to 80 cores.
- The CPU time spent on oneTBB scheduling or other parallel work arrangement is negligible.
- The modified code runs more than 10x faster than the original version of the application without collection time.