Tutorial: Detecting and Resolving Errors with MPI Correctness Checker
Analyzing Source Code
You can use the Intel® Trace Analyzer to view the reported deadlock problem. Open the MPI_Recv.stf file in Intel® Trace Analyzer:
$ traceanalyzer MPI_Recv.stf
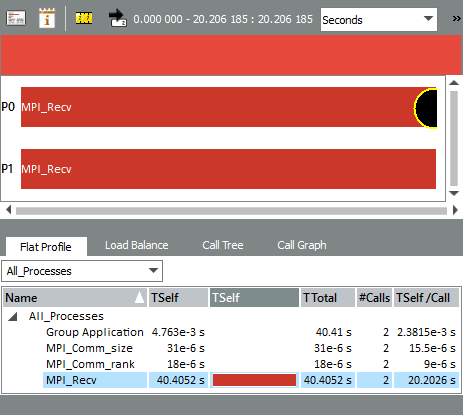
The trace information may look as follows:

In the Event Timeline chart, yellow-bordered circles represent various issues in your application. The color of each circle depends on the type of the particular diagnostic:
The black color indicates an error.
The gray color indicates a warning.

To determine which source code line is associated with an error message, right-click the issue on the Event Timeline chart and select Details on Function, Issue from the context menu. The following dialog will appear:

Click the Show Source button shown in the figure above to open the Source View. You can see that line 53 is highlighted, which indicates that it causes the deadlock:

In this example both processes call the blocking MPI_Recv function at once, so none of them get to calling the sender function, which causes the deadlock.