Answers to Top FAQs
1. System Debugging Tools Overview
2. Design Debugging with the Signal Tap Logic Analyzer
3. Quick Design Verification with Signal Probe
4. In-System Debugging Using External Logic Analyzers
5. In-System Modification of Memory and Constants
6. Design Debugging Using In-System Sources and Probes
7. Analyzing and Debugging Designs with System Console
8. Quartus® Prime Pro Edition User Guide Debug Tools Archives
A. Quartus® Prime Pro Edition User Guides
1.1. System Debugging Tools Portfolio
1.2. Tools for Monitoring RTL Nodes
1.3. Stimulus-Capable Tools
1.4. Virtual JTAG Interface Altera IP
1.5. System-Level Debug Fabric
1.6. SLD JTAG Bridge
1.7. Partial Reconfiguration Design Debugging
1.8. Preserving Signals for Debugging
1.9. System Debugging Tools Overview Revision History
2.1. Signal Tap Logic Analyzer Introduction
2.2. Signal Tap Debugging Flow
2.3. Step 1: Add the Signal Tap Logic Analyzer to the Project
2.4. Step 2: Configure the Signal Tap Logic Analyzer
2.5. Step 3: Compile the Design and Signal Tap Instances
2.6. Step 4: Program the Target Hardware
2.7. Step 5: Run the Signal Tap Logic Analyzer
2.8. Step 6: Analyze Signal Tap Captured Data
2.9. Simulation-Aware Signal Tap
2.10. Other Signal Tap Debugging Flows
2.11. Signal Tap Logic Analyzer Design Examples
2.12. Custom State-Based Triggering Flow Examples
2.13. Signal Tap File Templates
2.14. Running the Standalone Version of Signal Tap
2.15. Signal Tap Scripting Support
2.16. Merge Multiple Signal Tap files
2.17. Signal Tap File Version Compatibility
2.18. Design Debugging with the Signal Tap Logic Analyzer Revision History
2.4.1. Preserving Signals for Monitoring and Debugging
2.4.2. Preventing Changes that Require Full Recompilation
2.4.3. Specifying the Clock, Sample Depth, and RAM Type
2.4.4. Specifying the Buffer Acquisition Mode
2.4.5. Adding Signals to the Signal Tap Logic Analyzer
2.4.6. Defining Trigger Conditions
2.4.7. Specifying Pipeline Settings
2.4.8. Filtering Relevant Samples
2.4.6.1. Basic Trigger Conditions
2.4.6.2. Nested Trigger Conditions
2.4.6.3. Comparison Trigger Conditions
2.4.6.4. Advanced Trigger Conditions
2.4.6.5. Custom Trigger HDL Object
2.4.6.6. Specify Trigger Position
2.4.6.7. Power-Up Triggers
2.4.6.8. External Triggers
2.4.6.9. Trigger Condition Flow Control
2.4.6.10. Sequential Triggering
2.4.6.11. State-Based Triggering
2.4.6.12. Trigger Lock Mode
2.4.6.11.5.1. <state_label>
2.4.6.11.5.2. <boolean_expression>
2.4.6.11.5.3. <action_list>
2.4.6.11.5.4. Trigger that Skips Clock Cycles after Hitting Condition
2.4.6.11.5.5. Storage Qualification with Post-Fill Count Value Less than m
2.4.6.11.5.6. Resource Manipulation Action
2.4.6.11.5.7. Buffer Control Actions
2.4.6.11.5.8. State Transition Action
2.8.1. Viewing Capture Data Using Segmented Buffers
2.8.2. Viewing Data with Different Acquisition Modes
2.8.3. Creating Mnemonics for Bit Patterns
2.8.4. Locating a Node in the Design
2.8.5. Saving Captured Signal Tap Data
2.8.6. Exporting Captured Signal Tap Data
2.8.7. Creating a Signal Tap List File
2.8.8. Setting Floating-Point Bus Formats
2.10.1. Managing Multiple Signal Tap Configurations
2.10.2. Debugging Partial Reconfiguration Designs with Signal Tap
2.10.3. Debugging Block-Based Designs with Signal Tap
2.10.4. Debugging Devices that use Configuration Bitstream Security
2.10.5. Signal Tap Data Capture with the MATLAB* MEX Function
2.10.3.1.1. Partition Boundary Ports Method
2.10.3.1.2. Debug a Core Partition through Partition Boundary Ports
2.10.3.1.3. Export a Core Partition with Partition Boundary Ports
2.10.3.1.4. Signal Tap HDL Instance Method
2.10.3.1.5. Export a Core Partition with Signal Tap HDL Instances
2.10.3.1.6. Debug a Core Partition Exported with Signal Tap HDL Instances
3.1.1. Step 1: Reserve Signal Probe Pins
3.1.2. Step 2: Assign Nodes to Signal Probe Pins
3.1.3. Step 3: Connect the Signal Probe Pin to an Output Pin
3.1.4. Step 4: Compile the Design
3.1.5. (Optional) Step 5: Modify the Signal Probe Pins Assignments
3.1.6. Step 6: Run Fitter-Only Compilation
3.1.7. Step 7: Check Connection Table in Fitter Report
5.1. IP Cores Supporting In System Memory Content Editor
5.2. Debug Flow with the In-System Memory Content Editor
5.3. Enabling Runtime Modification of Instances in the Design
5.4. Programming the Device with the In-System Memory Content Editor
5.5. Loading Memory Instances to the ISMCE
5.6. Monitoring Locations in Memory
5.7. Editing Memory Contents with the Hex Editor Pane
5.8. Importing and Exporting Memory Files
5.9. Access Two or More Devices
5.10. Scripting Support
5.11. In-System Modification of Memory and Constants Revision History
6.1. Hardware and Software Requirements
6.2. Design Flow Using the In-System Sources and Probes Editor
6.3. Compiling the Design
6.4. Running the In-System Sources and Probes Editor
6.5. Tcl interface for the In-System Sources and Probes Editor
6.6. Design Example: Dynamic PLL Reconfiguration
6.7. Design Debugging Using In-System Sources and Probes Revision History
7.1. Introduction to System Console
7.2. Starting System Console
7.3. System Console GUI
7.4. Launching a Toolkit in System Console
7.5. Using System Console Services
7.6. On-Board Intel® FPGA Download Cable II Support
7.7. MATLAB* and Simulink* in a System Verification Flow
7.8. Running System Console in Command-Line Mode
7.9. Using System Console Commands
7.10. Using Toolkit Tcl Commands
7.11. Analyzing and Debugging Designs with the System Console Revision History
7.5.1. Locating Available Services
7.5.2. Opening and Closing Services
7.5.3. Using the SLD Service
7.5.4. Using the In-System Sources and Probes Service
7.5.5. Using the Monitor Service
7.5.6. Using the Device Service
7.5.7. Using the Design Service
7.5.8. Using the Bytestream Service
7.5.9. Using the JTAG Debug Service
2.4.1. Preserving Signals for Monitoring and Debugging
The Compiler optimizes the RTL signals during synthesis and place-and-route. Unless preserved, the signal names in your RTL may not exist in the post-fit netlist after signal optimizations. For example, the compilation process can merge duplicate registers, or add tildes (~) to net names that fan-out from a node.
To ensure that specific nodes in your RTL are available for Signal Tap debugging after synthesis and place-and-route, you can apply the preserve_for_debug attribute to the signals of interest in your RTL, and also specify the Enable preserve for debug assignments project .qsf setting. Refer to .qsf syntax in Debug Signal Preservation Methods.
When you preserve signals using this technique, the Compiler generates the Preserve for Debug Assignments report following synthesis that shows the status and name of all nodes with the preserve_for_debug attribute in your RTL.
Follow these steps to preserve signals for monitoring and debugging:
- In your design RTL, mark signals that you want to preserve with the preserve_for_debug attribute:
Figure 27. preserve_for_debug Attribute
- Open the project containing Signal Tap in the Quartus® Prime software and perform one of the following:
- To enable preservation and reporting for specific instances, click Assignments > Assignment Editor, and then specify the Enable preserve for debug assignments assignment To any instance of interest.
Or
- To enable preservation and reporting project-wide, in Assignments > Settings > Signal Tap Logic Analyzer, turn on Enable preserve for debug assignments.1
- To enable preservation and reporting for specific instances, click Assignments > Assignment Editor, and then specify the Enable preserve for debug assignments assignment To any instance of interest.
- To synthesize the design, on the Compilation Dashboard, click Analysis & Synthesis. The Compilation Report appears when synthesis is complete.
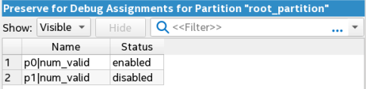
- To view the results of signal preservation, open the Preserve for Debug Assignments report located in the Synthesis > Partition <name> > Preserve for Debug report folder.
Figure 28. Preserve for Debug Assignments Report
- Run full compilation to perform place and route of the design and Signal Tap instance, as Step 3: Compile the Design and Signal Tap Instances describes. The debug signals that you preserve in step 2 persist through the Fitter into the finalized compilation database.
- Optionally, make some incremental changes to the Signal Tap configuration without running full recompilation, as Changing the Post-Fit Signal Tap Target Nodes describes.
Method | Description | Example |
---|---|---|
preserve_for_debug_enable | Set this assignment to On to preserve any nodes or hierarchies marked with preserve_for_debug. If set to Off or not used, any preserve_for_debug assignments are ignored. Use this as a quick way to disable all debug node preservation when optimizing a completed design. The Compiler reports these nodes in the Preserve for Debug Assignments report following compilation. | set_instance_assignment -name PRESERVE_FOR_DEBUG_ENABLE ON |
preserve_for_debug (Enable preserve for debug assignments in the Assignment Editor) |
Instance-specific .qsf assignment that overrides the global assignment and enables preservation of all types of nodes through synthesis post-synthesis or post-fit debugging purposes. When On, this assignment enables preservation for the hierarchy that you specify. You can enable or disable this with the Preserve signal for debug assignment in the Assignment Editor. The Compiler reports these nodes in the Preserve for Debug Assignments report following compilation. | set_instance_assignment -name PRESERVE_FOR_DEBUG ON -to <node hpath> |
Note: For more information about preserving signals, refer to Preserving Registers During Synthesis, in the Hyperflex® Architecture High-Performance Design Handbook and Preserving a System Module, Interface, or Port for Debugging in the Quartus® Prime Pro Edition User Guide: Platform Designer.
1 The global project setting has a more limited impact and does not preserve signals that would otherwise be optimized away in their local context.