Build and Run a Sample Using Visual Studio Code
Intel® oneAPI toolkits integrate with third-party IDEs to provide a seamless GUI experience for software development.
You need to install the Sample Browser extension to run samples. The next section describes how to do it. If you have already installed it, skip to Create a Project Using Visual Studio Code.
Extensions for Visual Studio Code
Watch a video on using oneAPI Visual Studio Code Extensions to set up your environment, try samples, and connect to the Intel® Developer Cloud.
You can use VS Code extensions to set your environment, create launch configurations, and browse and download samples:
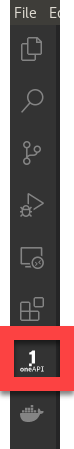
From Visual Studio Code, click on the Extensions logo in the left navigation tab.

- Locate the extension Extension Pack for Intel® oneAPI Toolkits, or visit Intel® Extensions on Visual Studio Marketplace to browse available extensions.
- Click Install.
For more information about VS Code extensions for Intel oneAPI Toolkits, see Using Visual Studio Code* to Develop Intel® oneAPI Applications.
Create a Project Using Visual Studio Code
- Click on the icon to open the oneAPI Samples Browser:
- A list of available samples will open in the left navigation.
- To view the README for the sample, click the
 next to the sample. If you choose to build and run the sample, the README will also be downloaded with the sample.
 - Find the sample you want to build and run. Click the
 to the right of the sample name.
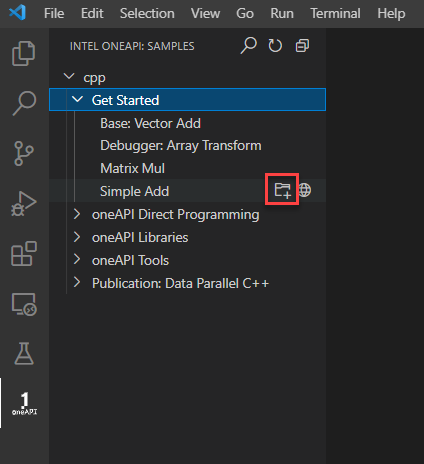
- Create a new folder for your sample and click OK.
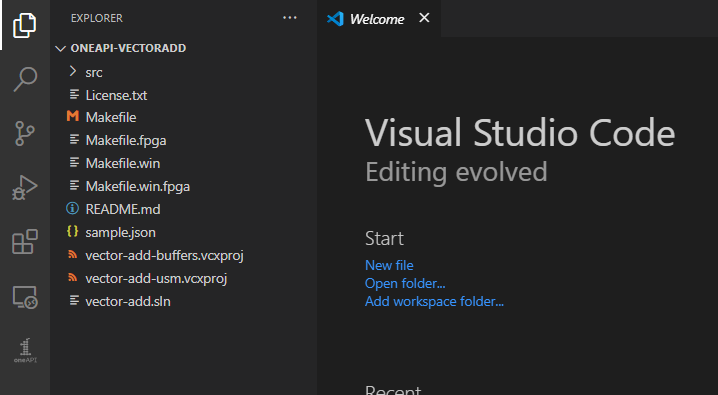
- The sample will load in a new window:
Set the oneAPI Environment
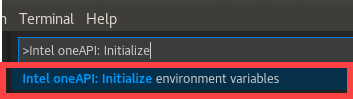
- Press Ctrl+Shift+P ( or View -> Command Palette… ) to open the Command Palette.
- Type Intel oneAPI: Initialize default environment variables. Click on Intel oneAPI: Initialize default environment variables.
Prepare Build Tasks from Make / CMake Files
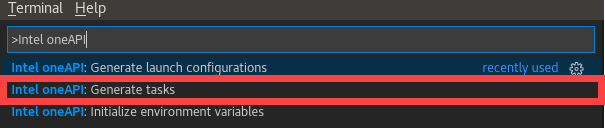
- Press Ctrl+Shift+P or View -> Command Palette… to open the Command Pallette.
- Type Intel oneAPI and select Intel oneAPI: Generate tasks.
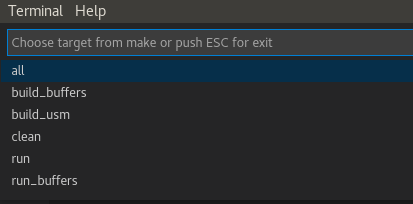
Select the build tasks (target) from your Make/CMake oneAPI project that you want to use.
Run the task/target by selecting Terminal -> Run task... .
Select the task to run.
Build the Project
The oneAPI extensions help you prepare launch configurations for running and debugging projects created with Intel oneAPI toolkits:
- Press Ctrl+Shift+B or Terminal -> Run Build Task... to set the default build task.
- Select the task from the command prompt list to build your project.
- Press Ctrl+Shift+B or Terminal -> Run Build Task... again to build your project.
Prepare Launch Configuration for Debugging
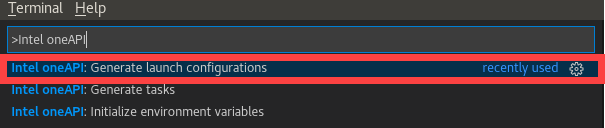
- Press Ctrl+Shift+P or View -> Command Palette... to open the Command Palette.
- Type Intel oneAPI and select Intel oneAPI: Generate launch configurations .
- Select the executable (target) you want to debug.
Optional: select any task you want to run before and/or after launching the debugger (for example, build the project before debug, clean the project after debug).
- The configuration is now available to debug and run using the gdb-oneapi debugger. You can find it in .vscode/launch.json. To debug and run, click on the Run icon or press Ctrl+Shift+D.
Debug, Analyze, Develop with More Extensions
There are more oneAPI extensions for Visual Studio Code which enable:
- debugging
- remote development
- connection to Intel Developer Cloud
- analysis configuration
To learn more about the extensions and different configuration options, see Intel® oneAPI Extensions for Visual Studio Code* and Using Visual Studio Code with Intel® oneAPI Toolkits.