Intel® Inspector Tutorial: Analyzing Threading Errors in a Fortran Sample Application for Windows* OS
Standalone GUI: Build Application and Create New Project
Intel® Inspector is a dynamic memory and threading error checking tool for users developing serial and multithreaded applications on Windows* and Linux* operating systems. This topic is part of a tutorial that shows how to find and fix threading errors using the Intel Inspector and a Fortran sample application.
Follow these steps only if you are using the Intel Inspector standalone GUI to complete this tutorial.
To create an application the Intel Inspector can inspect for threading errors:
Get Software Tools
You need the following tools to try tutorial steps yourself using the nqueens_fortran sample application:
Intel Inspector installation package and license
.zip file extraction utility
Supported compiler (see Release Notes for more information)
Acquire the Intel Inspector
If you do not already have access to the Intel Inspector, you can download it for free as follows:
Install and Set Up the Intel Inspector Sample Applications
Copy the nqueens_fortran.zip file from the <install-dir>\samples\<locale>\Fortran\ directory to a writable directory or share on your system. The default <install-dir> is below C:\Program Files\Intel (x86)\ (on certain systems, instead of Program Files (x86), the directory name is Program Files).
Extract the sample from the .zip file to create the nqueens_fortran directory.
Samples are non-deterministic. Your screens may vary from the screen captures shown throughout this tutorial.
Samples are designed only to illustrate the Intel Inspector features; they do not represent best practices for creating code.
Understand Optimal Compiler/Linker Settings
You can use the Intel® Inspector to analyze memory and threading errors in both debug and release modes of C++ and Fortran binaries; however, applications compiled/linked in debug mode using the following settings produce the most accurate and complete analysis results.
Compiler/Linker Property |
Correct C/C++ Setting |
Impact If Not Set Correctly |
|---|---|---|
Debug information |
Enabled (/Zi or /ZI) |
Missing file/line information |
Optimization |
Disabled (/Od) |
Incorrect file/line information |
Dynamic runtime library |
Selected (/MD or /MDd) |
False positives or missing code locations |
Basic runtime error checks |
Disabled (do not use /RTC; Default option in Visual Studio* IDE) |
False positives |
Compiler/Linker Property |
Correct Fortran Setting |
Impact If Not Set Correctly |
Debug information |
Enabled (/debug:full) |
Missing file/line information |
Optimization |
Disabled (/Od) |
Incorrect file/line information |
Dynamic runtime library |
Selected (/libs:dll/threads or libs:dll/threads/dbglibs ) |
False positives or missing code locations |
Basic runtime error checks |
None (/check:none) |
False positives |
Build the Application
Find Visual Studio Tools for your Visual Studio* and OS version, and select one of the command prompt shortcuts. For example, from the Microsoft Windows* 10 All Apps screen, select Visual Studio 2013 > Visual Studio Tools > VS2013 x64 Native Tools Command Prompt.
In the command prompt window, change directory to the nqueens_fortran\ directory in its unzipped location.
Type devenv nqueens_fortran.sln /Build to build all projects in the solution.
Verify the Application Runs Outside the Intel Inspector
Change directory to threading_issues\Debug\.
Type threading_issues.exe to execute the application.
Check for non-deterministic application output (that also varies by number of cores) similar to the following:
Usage: threading_issues.exe boardSize
Using default size of 10
Starting nqueens solver for size 10 with 2 thread(s)
Number of solutions: 1333
Incorrect result!
Calculations took 31 ms.
Set up the Intel Inspector Environment
Setting up the Intel Inspector environment is necessary only if you plan to use the inspxe-gui command to launch the Intel Inspector standalone GUI or the inspxe-cl command to run the command line interface.
For the Intel Inspector in the Intel Parallel Studio XE, do one of the following to set up your environment:
Run the <inspector-install-dir>\inspxe-vars.bat command.
The default installation path, <inspector-install-dir>, is below C:\Program Files (x86)\IntelSWTools\ (on certain systems, instead of Program Files (x86), the directory name is Program Files ).
Run the <studio-install-dir>\psxevars.bat command.
The default installation path, <studio-install-dir>, is below C:\Program Files (x86)\IntelSWTools\.
For the Intel Inspector in the Intel System Studio, run the <inspector-install-dir>\inspxe-vars.bat command to set up your environment. The default installation path, <inspector-install-dir>, is below C:\Program Files (x86)\IntelSWTools\ (on certain systems, instead of Program Files (x86), the directory name is Program Files ).
For the application as part of an Intel® HPC Toolkit or Intel® IoT Toolkit installation, run the <oneapi-install-dir>\env\vars.bat command. The default installation path, <oneapi-install-dir>, is inside C:\Program Files (x86)\Intel\oneAPI .
Keep the command prompt window open.
Open the Intel Inspector Standalone GUI
For the Intel Inspector standalone GUI in the Intel Parallel Studio XE, do one of the following:
Run the inspxe-gui command.
From the Microsoft Windows* 7 Start menu, select Intel Parallel Studio XE [version] > Analyzers > Intel Inspector [version].
From the Microsoft Windows* 8/8.1/10 All Apps screen, select Intel Parallel Studio XE [version] > Intel Inspector [version].
For the Intel Inspector standalone GUI in the Intel System Studio, do one of the following:
Run the inspxe-gui command.
From the Microsoft Windows* 7 Start menu, select Intel System Studio [version] for Windows target > Analyzers > Intel Inspector [version] for Systems.
From the Microsoft Windows* 8/8.1/10 All Apps screen, select Intel System Studio [version] for Windows target > Intel Inspector [version] for Systems.
Create a New Project
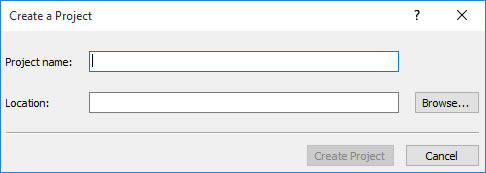
Choose File > New > Project... to display a dialog box similar to the following:

In the Project name field, type threading_issues. Then click the Create project button to create a config.inspxeproj file in the \Inspector\Projects\threading_issues\ directory (default location) and display a dialog box similar to the following:

Click the Browse button next to the Application field and select the nqueens_fortran\threading_issues\Debug\threading_issues.exe application. Notice the Intel Inspector autofills the project Working directory field for you. Then click the OK button to return to the Welcome page, where the name of the opened project displays in the title bar and in the Project Navigator pane. (If necessary, choose View > Project Navigator to display the Project Navigator.)