Tutorial
Intel® Inspector Tutorial: Analyzing Threading Errors in a C++ Sample Application for Windows* OS
Navigation Quick Start
Intel® Inspector is a dynamic memory and threading error checking tool for users developing serial and multithreaded applications on Windows* and Linux* operating systems. This topic is part of a tutorial that shows how to find and fix threading errors using the Intel Inspector and a C++ sample application.
Set up the Intel Inspector Environment
Setting up the Intel Inspector environment is necessary only if you plan to use the inspxe-gui command to launch the Intel Inspector standalone GUI or the inspxe-cl command to run the command line interface.
For the standaloneIntel Inspector, run the <inspector-install-dir>\inspxe-vars.bat command.
The default installation path, <inspector-install-dir>, is inside C:\Program Files (x86)\IntelSWTools\ (on certain systems, instead of Program Files (x86), the directory name is Program Files ).
For the application as part of an Intel® HPC Toolkit or Intel® IoT Toolkit installation, run the <oneapi-install-dir>\env\vars.bat command. The default installation path, <oneapi-install-dir>, is inside C:\Program Files (x86)\Intel\oneAPI .
Open the Intel Inspector Standalone GUI
For the Intel Inspector standalone GUI, do one of the following:
Run the inspxe-gui command.
From the Microsoft Windows* 7 Start menu, select Intel Inspector [version].
From the Microsoft Windows* 8/8.1/10 All Apps screen, select Intel Inspector [version].
Navigate the Intel Inspector Standalone GUI
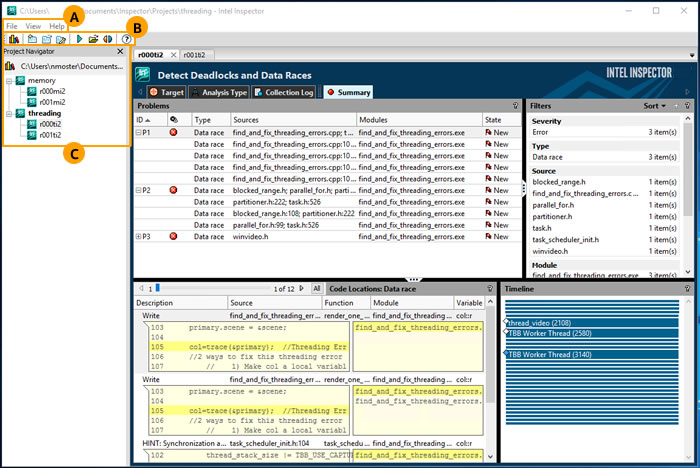
The menu, toolbar, and Project Navigator offer different ways to perform many of the same functions. |
|
A |
Use the menu to create projects and dynamic analysis results, import result archive files and results from other Intel error-detection products, open projects and results, compare results, configure projects, set various options, and access the Getting Started page and Help. |
B |
Use the toolbar to open the Getting Started page; create, configure, and open projects; create dynamic analysis results; and open and compare results. |
C |
Use the Project Navigator:
|
Navigate the Intel Inspector in the Microsoft Visual Studio* IDE
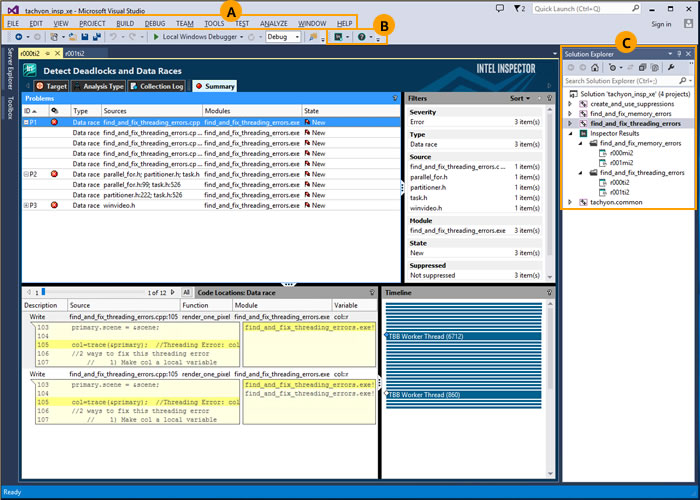
The menu, toolbar, and Solution Explorer offer different ways to perform many of the same functions. |
|
A |
Use the Tools > Intel Inspector [version] menu to create analysis results; compare results; and import result archive files, results not associated with a project, and results from other Intel error-detection products into the current project. |
B |
Use the Intel Inspector toolbar to create analysis results, compare results, configure projects, and open documentation resources. |
C |
Solution Explorer context menus (right-click to open):
|
Navigate the Intel Inspector Result Tabs

1 |
Use result tab names to distinguish among results. |
2 |
Click buttons on the navigation toolbar to change window views. |
3 |
Use window panes to view and manage result data. |
4 |
Click |
5 |
Drag window pane borders to resize window panes. |
6 |
Click |
7 |
Click window pane data controls to adjust result data within the pane (and possibly in adjacent panes). |
8 |
Use title bars to identify window panes. |
9 |
Data column headers - Drag to reposition the data column; drag the left or right border to resize the data column; click to sort results in ascending or descending order by column data. |
10 |
Right-click data in window panes to display context menus that provide access to key capabilities. |
 ,
,  ,
,  , and
, and  controls to show/hide window panes.