Tutorial
Intel® Inspector Tutorial: Analyzing Threading Errors in a C++ Sample Application for Windows* OS
Visual Studio* IDE: Choose Project and Build Application
Intel® Inspector is a dynamic memory and threading error checking tool for users developing serial and multithreaded applications on Windows* and Linux* operating systems. This topic is part of a tutorial that shows how to find and fix threading errors using the Intel Inspector and a C++ sample application.
Follow these steps only if you are using the Intel Inspector plug-in to the Visual Studio* IDE to complete this tutorial.
To create an application the Intel Inspector can inspect for threading errors:
Get Software Tools
You need the following tools to try tutorial steps yourself using the tachyon_insp_xe sample application:
Intel Inspector installation package and license
.zip file extraction utility
Supported compiler (see Release Notes for more information)
Acquire the Intel Inspector
If you do not already have access to the Intel Inspector, you can download an evaluation copy from http://software.intel.com/en-us/articles/intel-software-evaluation-center/.
Install and Set Up the Intel Inspector Sample Applications
Copy the tachyon_insp_xe.zip file from the <install-dir>\samples\<locale>\C++\ directory to a writable directory or share on your system. The default <install-dir> is below C:\Program Files (x86)\Intel\ (on certain systems, instead of Program Files (x86), the directory name is Program Files).
Extract the sample from the .zip file.
Samples are non-deterministic. Your screens may vary from the screen captures shown throughout this tutorial.
Samples are designed only to illustrate the Intel Inspector features; they do not represent best practices for creating code.
Open a Visual Studio* Solution
Choose File > Open > Project/Solution.
In the Open Project dialog box, open the tachyon_insp_xe\vc10\tachyon_insp_xe.sln file to display the tachyon_insp_xe solution in the Solution Explorer.
NOTE:The tachyon_insp_xe.sln solution was created using the Visual Studio* 2010 IDE. If the Visual Studio* conversion wizard appears, follow the steps to convert the solution to run on your installed version of the Visual Studio* IDE.
Choose a Startup Project
If the find_and_fix_threading_errors project is not the startup project (project typeface in the Solution Explorer is not bold),
Right-click the find_and_fix_threading_errors project in the Solution Explorer.
Choose Set as StartUp Project, which changes the project typeface to bold.
Understand Optimal Compiler/Linker Settings
You can use the Intel® Inspector to analyze memory and threading errors in both debug and release modes of C++ and Fortran binaries; however, applications compiled/linked in debug mode using the following settings produce the most accurate and complete analysis results.
Compiler/Linker Property |
Correct C/C++ Setting |
Impact If Not Set Correctly |
|---|---|---|
Debug information |
Enabled (/Zi or /ZI) |
Missing file/line information |
Optimization |
Disabled (/Od) |
Incorrect file/line information |
Dynamic runtime library |
Selected (/MD or /MDd) |
False positives or missing code locations |
Basic runtime error checks |
Disabled (do not use /RTC; Default option in Visual Studio* IDE) |
False positives |
Compiler/Linker Property |
Correct Fortran Setting |
Impact If Not Set Correctly |
Debug information |
Enabled (/debug:full) |
Missing file/line information |
Optimization |
Disabled (/Od) |
Incorrect file/line information |
Dynamic runtime library |
Selected (/libs:dll/threads or libs:dll/threads/dbglibs ) |
False positives or missing code locations |
Basic runtime error checks |
None (/check:none) |
False positives |
The sample code is already set. Follow these steps if you need to change settings for your application.
If the Solutions Configuration drop-down on the Visual Studio* Standard toolbar is set to Release, change it to Debug.
Right-click the find_and_fix_threading_errors project in the Solution Explorer, then choose Properties to display the Property Pages dialog box.
In the left pane, choose Configuration Properties > C/C++.
Choose General and verify the Debug Information Format field is set to Program Database (/Zi) or Program Database for Edit & Continue (/ZI).
Choose Optimization and verify the Optimization field is set to Disabled (/Od).
Choose Code Generation. Verify the Runtime Library field is set to Multi-threaded DLL (/MD) or Multi-threaded Debug DLL (/MDd) and the Basic Runtime Checks field is set to Default.
In the left pane, choose Configuration Properties > Linker > Debugging and verify the Generate Debug Info field is set to Yes (/DEBUG).
Click the Apply button, then click the OK button to close the Property Pages dialog box.
Build and Test the Application
Choose Build > Solution to build all projects in the solution.
Check the messages in the Output window to confirm the build succeeded.
Choose Debug > Start Without Debugging to test the application.
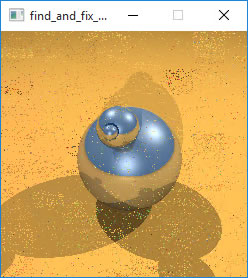
Check for non-deterministic application output similar to the following:

Notice the off-color dots in the image. The cause: Threading errors.