Tutorial
Intel® Inspector Tutorial: Analyzing Threading Errors in a C++ Sample Application for Linux* OS
Interpret Result Data
Intel® Inspector is a dynamic memory and threading error checking tool for users developing serial and multithreaded applications on Windows* and Linux* operating systems. This topic is part of a tutorial that shows how to find and fix threading errors using the Intel Inspector and a C++ sample application.
To determine the cause of the detected threading error:
Interpret Sources Window Pane Tabs
A Sources window similar to the following displays after you double-click the data row for the first Data race problem in the problem set. It provides more visibility into the cause of the error.
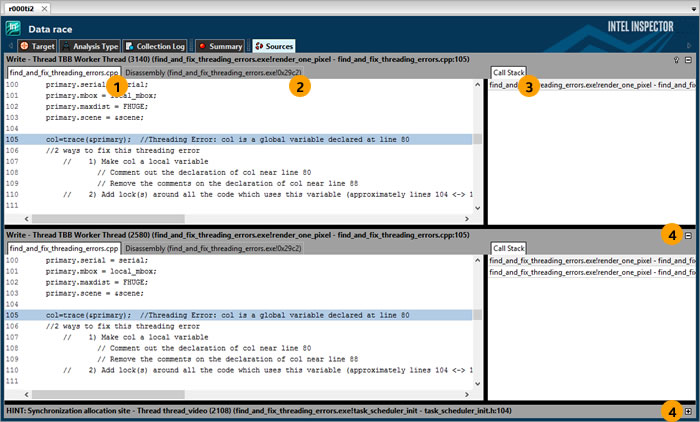
1 |
The Source tab shows the complete source surrounding one code location in the Data race problem. (Samples are non-deterministic; you may see a memory Write or a memory Read code location.) |
2 |
The Disassembly tab shows low-level operations for the code location in the Data race problem. |
3 |
The Call Stack tab shows the complete call stack for the code location in the Data race problem. |
4 |
This region shows source, disassembly, and call stack information for another code location in the Data race problem. (Samples are non-deterministic; you may see a memory Write or a memory Read code location.) Use the |
 icons to expand/collapse source, disassembly, and call stack information for each code location region in the Data race problem.
 Access More Information on Interpreting and Resolving Problems
Right-click anywhere in the Source or Disassembly tab.
Choose Explain Problem to display the Intel Inspector Help information for the Data race problem type.