Tutorial: Analyzing Memory Errors With Intel® Inspector and a C++ Sample Application for Linux* OS
Run Analysis
Intel® Inspector is a dynamic memory and threading error checking tool for users developing serial and multithreaded applications on Windows* and Linux* operating systems. This topic is part of a tutorial that shows how to find and fix memory errors using the Intel Inspector and a C++ sample application.
To find memory errors that may need fixing, click the Start button on the Analysis Type window. The Intel Inspector:
Executes the tachyon.find_and_fix_memory_errors application.
Identifies memory errors that may need handling.
Collects the result in a directory in the intel/inspxe/projects/memory/ directory.
Finalizes the result.
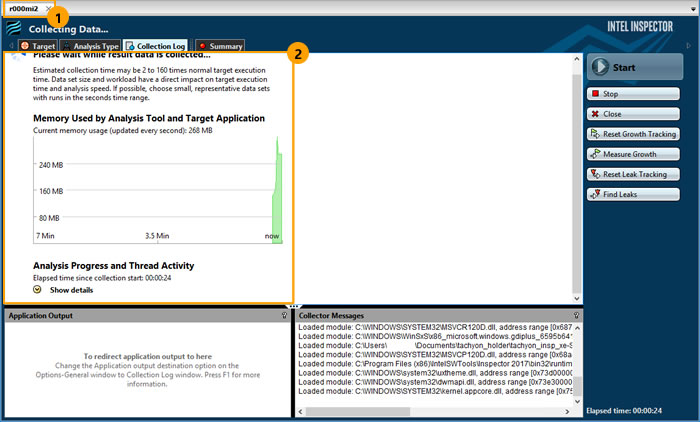
During analysis, the Intel Inspector displays a Collection Log window similar to the following:
1 |
The result name appears in the tab. Here, the name of the result is r000mi2, where
NOTE:
Intel Inspector also offers a pointer to the result in the Project Navigator. |
2 |
The Collection Log pane shows analysis progress and milestones. Notice you can start to manage results before analysis (collection and finalization) is complete by clicking the Summary button; however, this tutorial does not cover handling issues before analysis is complete. |
This tutorial explains how to run an analysis from the Intel Inspector standalone GUI. You can also use the Intel Inspector command line interface (inspxe-cl command) to run an analysis.
The Summary window automatically displays after analysis completes successfully.