Switch Between a CPU Context and a GPU Context When Debugging with VSCode*
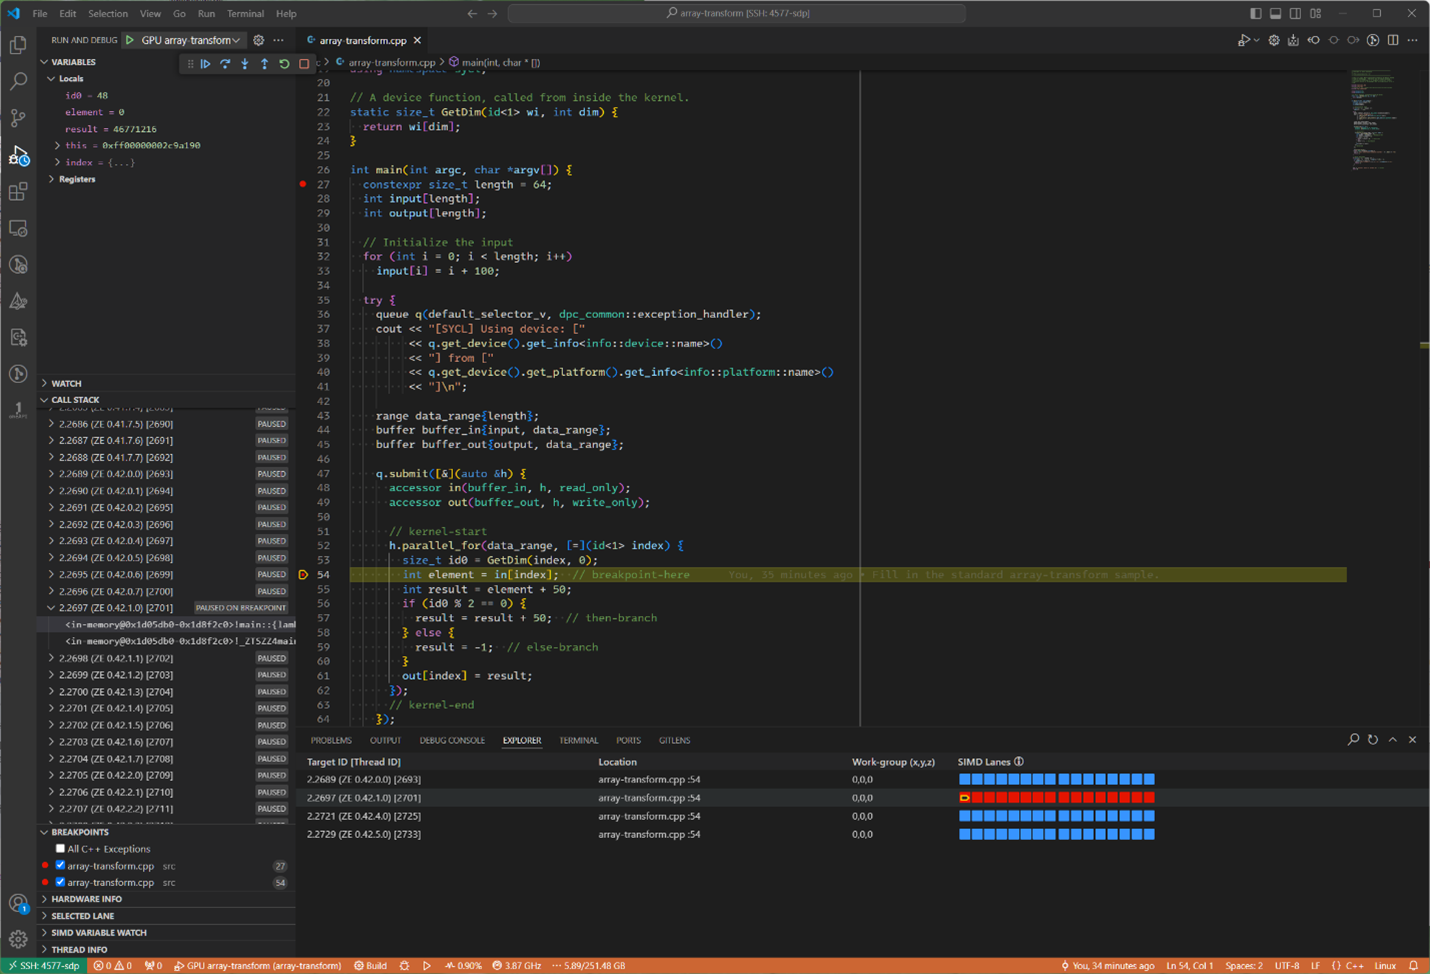
When gdb-oneapi hits a GPU breakpoint, you view the context of that GPU thread, i.e., the local variables in that thread. If you need to “go back” and inspect some variables in a CPU thread, you need to scroll to the top of the “CALL STACK” and locate the “main” thread.
Before scrolling through the threads in the CALL STACK window you should make note of the GPU thread that you are leaving, if you want to return to the current GPU thread. See the relationship, below, of the various thread identifiers when viewing the SIMD Lanes:
When you scroll to the top of the CALL STACK, you’ll find the “main” thread’s current context. Note that the “main” thread only runs on the CPU, not on a GPU. That main thread will look something like the following, which shows a collection of local variables that are present in that CPU thread:
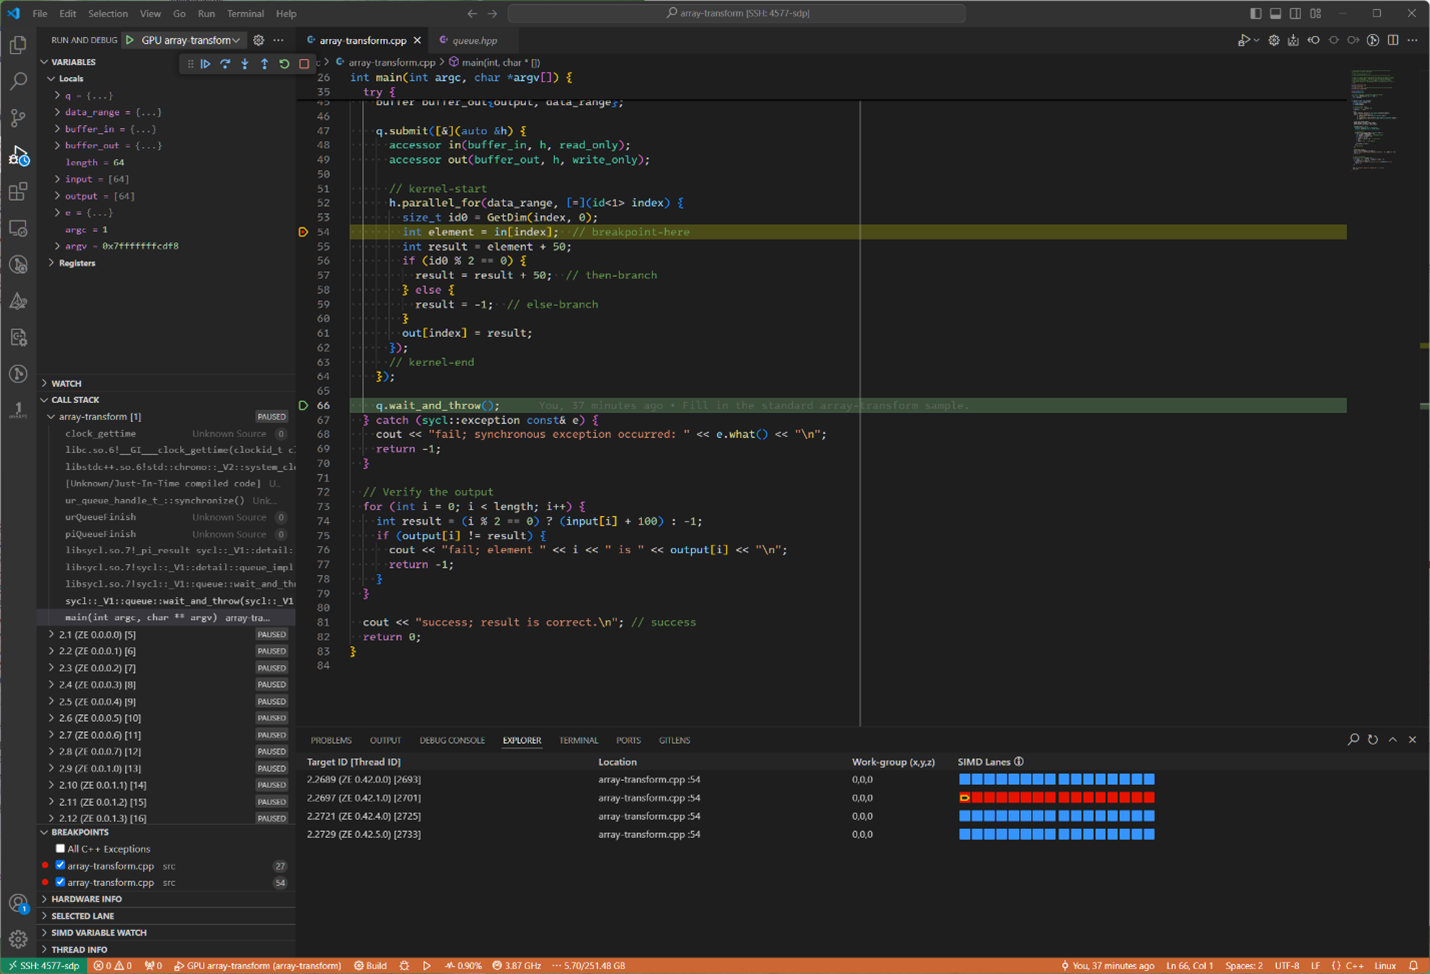
If you need to get back to the GPU thread that hit the GPU breakpoint, you will have to scroll back down to the numbered thread that you saved, before scrolling up to the CPU thread. There may be many unused GPU execution units, especially when running a GPU kernel that operates on relatively small arrays and matrices.