A newer version of this document is available. Customers should click here to go to the newest version.
Explore Performance Gain from GPU-to-GPU Modeling
Enabled Analyses
Performance collection for GPU kernels only (Survey, Characterization) + Performance modeling for GPU kernels only
Result Interpretation
You can view the result generated in the following:
- Review the result summary and a result file location printed to a command prompt or a terminal.
- Review the project result in Intel® Advisor graphical user interface (GUI) generated to the project directory.
- Review HTML reports generated to the <project-dir>/e<NNN>/report directory.
- Review a set of CSV reports with detailed metric tables generated to the <project-dir>/e<NNN>/pp<NNN>/data.0 directory.
This topic describes data as it is shown in the Offload Modeling report in the Intel Advisor GUI. You can also view the results using an HTML report, but data arrangement and some metric names may vary.
The structure and controls of the GPU-to-GPU performance modeling report generated for the are similar to the CPU-to-GPU offload modeling report, but the content is different because for the GPU-to-GPU modeling, Intel Advisor models performance only for GPU-enabled parts of your application.
When you open the report, it first shows the Summary tab. In this tab, you can review the summary of the modeling results and estimated performance metrics for some GPU kernels in your application.
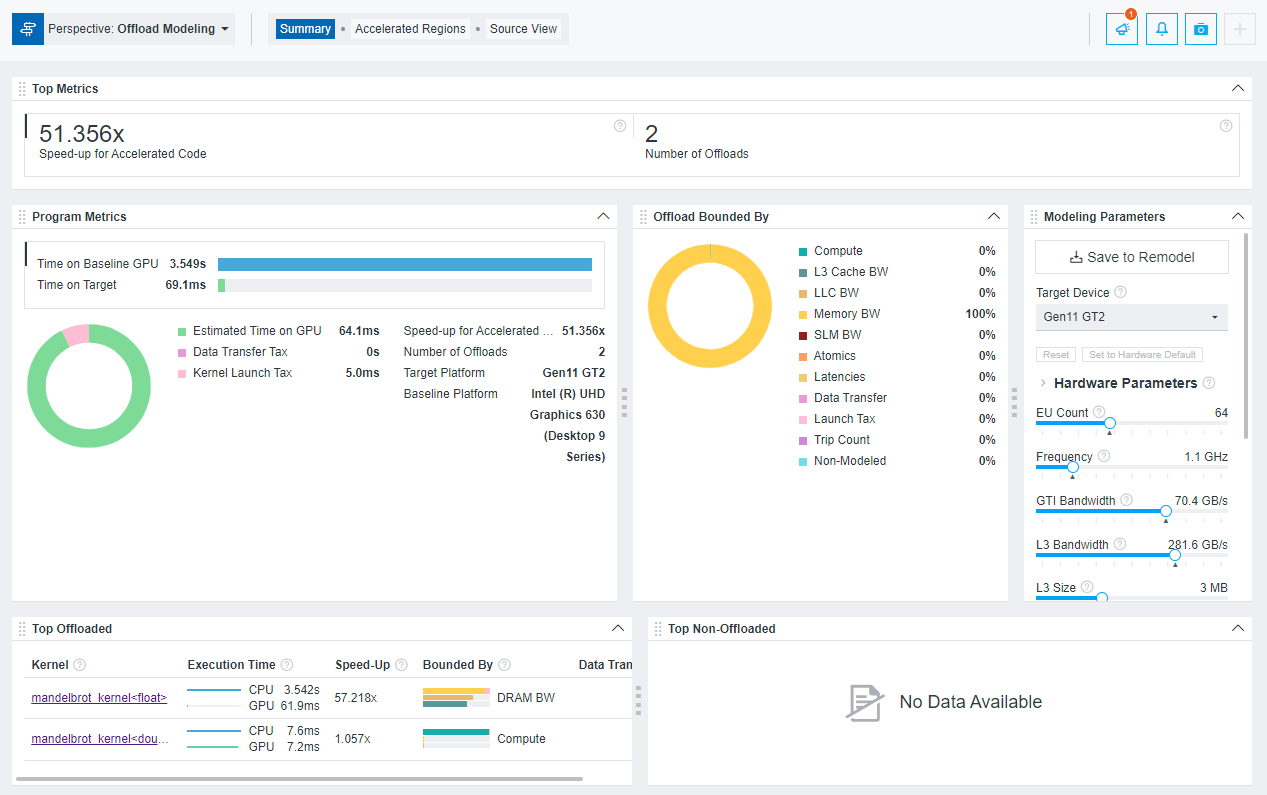
- In the Program Metrics pane, compare the Time on Baseline GPU and Time on Target GPU and examine the Speedup for Accelerated Code to understand if the GPU kernels in your application have a better performance on a target GPU. Time on Baseline GPU includes only execution time of the GPU kernels and ignores the CPU parts of your application. Time on Target GPU includes estimated execution time for GPU kernels on the target GPU and offload taxes.
In the pie chart, review ratio of GPU execution time and offload taxes (kernel launch tax and data transfer tax) and see where the GPU kernels spend most of the time.
- In the Offloads Bounded by pane, examine what the GPU kernels are potentially bounded by on the target GPU. The parameters with the highest percentage mean that this is where the GPU kernels spend the most time. Review the detailed metrics for these parameters in other tabs to understand if you need to optimize your application for this.
- In the Top offloaded pane, review the top five GPU kernels with the highest absolute offload gain (in seconds) estimated on the target GPU. The gain is calculated as (Time measured on the baseline GPU - Time estimated on the target GPU).
For each kernel in the pane, you can review the speedup, time on the baseline and the target GPUs, main bounded-by parameters, and estimated amount of data transferred. Intel Advisor models kernels one-to-one and does not filter out kernels with estimated speedup less than 1.
To see the details about GPU kernel performance, go to the Accelerated Regions tab.
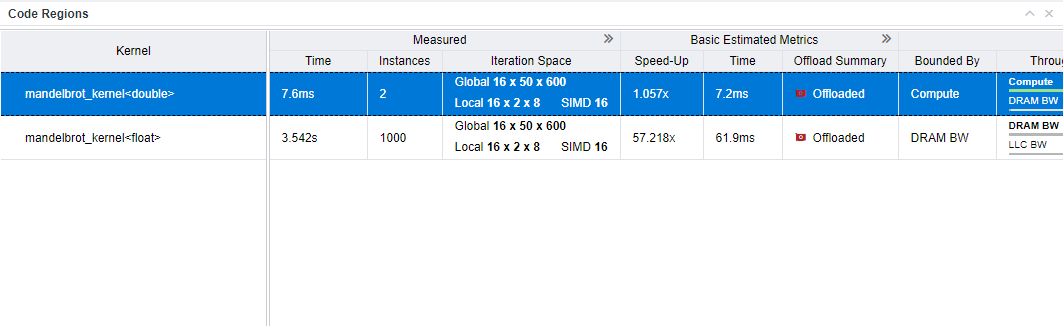
- In the Code Regions table, examine the detailed performance metrics for the GPU kernels. The Measured column group shows metrics measured on the baseline GPU. Other column groups show metrics estimated for the target GPU. You can expand column groups to see more metrics.
You can also select a kernel in the table and examine the highlight measured and estimated metrics for it in the Details tab of the right-side pane to identify what you need to focus on.
For example, to find a potential bottleneck:
- Examine the Estimated Bounded by column group focusing on the Bounded by and Throughput columns. In the Bounded by column, you can see the main bottleneck and secondary bottlenecks. The Throughput expands the bottlenecks with time by compute or memory throughput, latencies, and offload taxes shown as a chart. See Bounded By for bottleneck details.
- For details about the bounding factors, expand the column group and find the columns corresponding to these bounding factors, for example, L3 Cache BW, DRAM BW, or LLC BW.
- Scroll to the right, expand the Memory Estimations column group, and examine the columns corresponding to the bottleneck identified. For example, the bandwidth utilization is calculated as a relation of average memory level bandwidth to its peak bandwidth. High value means that the kernel does not use well this memory level and it is the potential bottleneck.
You can also review the following data to find bottlenecks:
- If you see high cache or memory bandwidth utilization (for example, in the L3 Cache, SLM, LLC column groups), consider optimizing cache/memory traffic to improve performance.
- If you see high latency in the Estimated Bounded By column group, consider optimizing cache/memory latency by scheduling enough parallel work for this kernel to increase thread occupancy.
- If you see high data transfer tax in the Estimated Data Transfer with Reuse, consider optimizing data transfer taxes or using unified shared memory (USM).
- If you see a high data transfer tax for a kernel, select the kernel in the Code Regions table and examine the details about memory objects transferred between the host device and a target GPU for a kernel in the right-side Data Transfer Estimations pane. Review the following data:
- The histogram for the transferred data that shows amount of data transferred in each direction and the corresponding offload taxes.
- The memory object table that lists all memory objects accessed by the kernel with details about each object, such as size, transfer direction (only to the host, only to the target, from the host to the target and back), object type. If you see a lot of small-sized objects, this may result in high latency for the kernel. High latency might cause a high data transfer tax.
- Hints about optimizing data transfers in the selected code region.
Intel Advisor uses this data to estimate data transfer traffic and data transfers for each kernel.
Next Steps
- Based on collected data, rewrite your code to offload it to a different target GPU to improve performance and measure its performance with the GPU Roofline Insights perspective.
- See optimization tips for oneAPI applications running on GPU in the oneAPI GPU Optimization Guide.