Analyze a SYCL Application with GPU Roofline
This recipe illustrates how to use Intel® Advisor command line interface (CLI) to run GPU Roofline Insights perspective on a SYCL implementation of the Mandelbrot application running on a graphics processing unit (GPU) and visualize results in command line output, Python* API, graphical user interface (GUI), and Interactive HTML report.
Intel Advisor provides the GPU Roofline Insights perspective to evaluate and improve performance of GPU kernels in SYCL, C++/Fortran with OpenMP* target, Intel® oneAPI Level Zero API (Level Zero), and OpenCL™ applications. Use GPU Roofline Insights perspective to do the following:
- Evaluate code executed on a GPU to see how close the performance is to the current hardware-imposed ceilings.
- Detect and prioritize bottlenecks by estimated performance gain and understand their likely causes, such as memory bound vs compute bound.
- Pinpoint the exact compute peak or memory level (caches, memory, or compute throughput) causing a bottleneck.
- Identify which optimizations will pay off the most and apply actionable code restructuring recommendations specific to your application.
- Visualize optimization progress and compare different code versions plotted on a single Roofline chart.
Directions:
- Prerequisites.
- Run GPU Roofline Insights perspective.
- View GPU Roofline results.
- Examine the Application Performance on GPU.
- Explore detailed GPU metrics with Intel Advisor Python* API.
- Alternative steps.
Ingredients
This section lists the hardware and software used to produce the specific results shown in this recipe:
- Performance analysis tool:Intel Advisor
Available for download at https://www.intel.com/content/www/us/en/developer/tools/oneapi/advisor.html
- Application:Mandelbrot is a SYCL application that generates a fractal image by matrix initialization and performs pixel-independent computations.
- Compiler: Intel® oneAPI DPC++/C++ Compiler
Available for download at https://www.intel.com/content/www/us/en/developer/tools/oneapi/dpc-compiler.html.
- Operating system: Ubuntu* 20.04.2 LTS
- CPU: Intel® Core™ i7-8559U
- GPU: Intel® Iris® Plus Graphics 655
You can download a precollected GPU Roofline report for the SYCL Mandelbrot application to follow this recipe and examine the analysis results.
Prerequisites
- Set up environment. For example:
source /opt/intel/oneapi/setvars.sh - Compile the sample application:
cd mandelbrot/ && mkdir build && cd build && cmake .. && make - Configure your system to analyze GPU kernels.
Run GPU Roofline Insights Perspective
To collect GPU Roofline data, run the following command line:
advisor --collect=roofline --profile-gpu --project-dir=./adv_gpu_roofline -- ./src/mandelbrotAfter you run the command, Intel Advisor collects data both for GPU kernels and CPU loops/functions in your application to plot a Roofline chart.
Continue to view the collected results using one of the methods described below.
View GPU Roofline Results
Intel Advisor stores the results of analyses with analysis configurations in the adv_gpu_roofline directory specified with --project-dir option. You can visualize the collected results in several output formats.
View Results in CLI
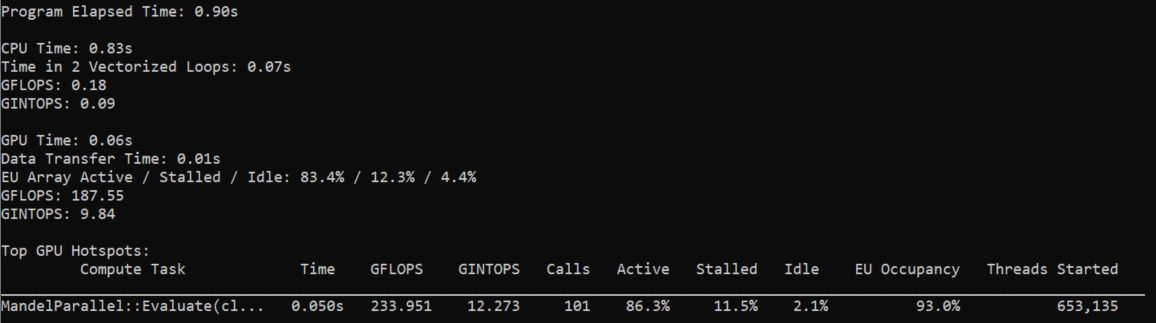
After you run the command, the result summary is printed to the terminal. It contains a summary of metrics for the whole application and for its CPU and GPU parts. The information about top GPU hotspots is displayed as a table with execution time, number of operations per second, number of calls, and execution units-related metrics for each GPU hotspot.
To see metrics for all GPU hotspots, run the following report command with --gpu option:
advisor --report=survey --gpu --project-dir=./adv_gpu_roofline
To view more data columns, add --show-all-columns option:
advisor --report=survey --gpu --show-all-columns --project-dir=./adv_gpu_rooflineExport Results as an Interactive HTML Report
Generate an interactive HTML report that you can share and view in your web browser:
advisor --report=all --project-dir=./adv_gpu_roofline --report-output=./gpu_roofline_report.htmlThis command creates an interactive HTML report that has the similar structure of results as GUI. The interactive HTML report contains GPU metrics presented in the grid view and plotted on a Roofline chart. The Roofline chart displays data for floating-point operations, integer operations, and all memory levels that are available in adv_gpu_roofline results.
View Results in GUI
The easiest way to view results is to open them on the same machine where they were collected if it has Intel Advisor GUI installed. In this case, you open an existing Intel Advisor result without creating any additional files or reports.
To open a result in the GUI, run the following command:
advisor-gui ./adv_gpu_rooflineSave a Read-Only Result Snapshot (Instead of HTML and GUI Reports)
If you do not have Intel Advisor GUI installed on the target machine, copy your results to a shared drive and open it on another machine or copy the results directly to the client machine.
To create a snapshot and pack it into an archive including sources and binaries, run the following command:
advisor --snapshot --project-dir=./adv_gpu_roofline --pack --cache-sources --cache-binaries -- ./my_snapshotThe snapshot archive named my_snapshot.advixeexpz is saved into the directory specified by the --project-dir option. lt is stored in the adv_gpu_roofline directory.
To open the result snapshot in Intel Advisor GUI, run the following command:
advisor-gui ./my_snapshotYou can open a snapshot from Intel Advisor GUI by selecting the snapshot in the File > Open > Result menu.
For more information, see Snapshot.
Examine the Application Performance on GPU
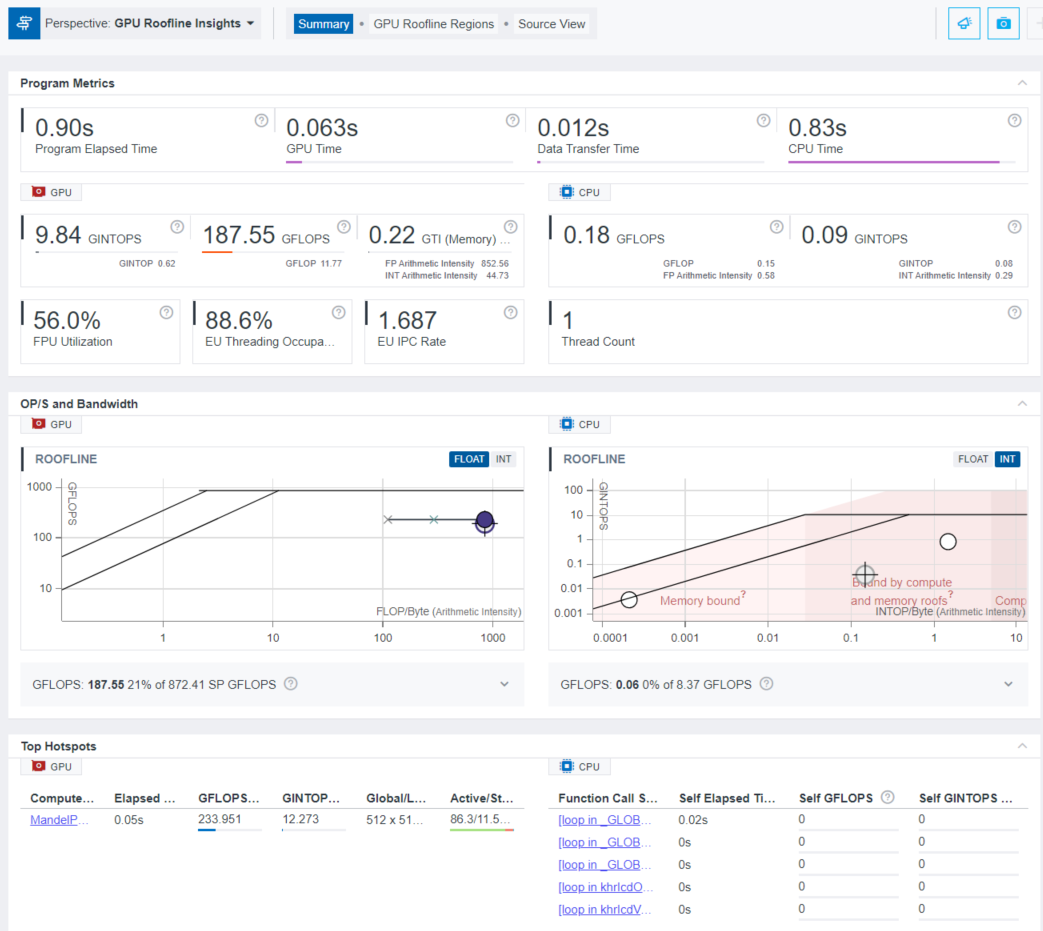
By default, Intel Advisor displays the Summary tab. It shows the general metrics of the whole application, of its GPU and CPU parts. You can also examine the preview Roofline charts for your application.
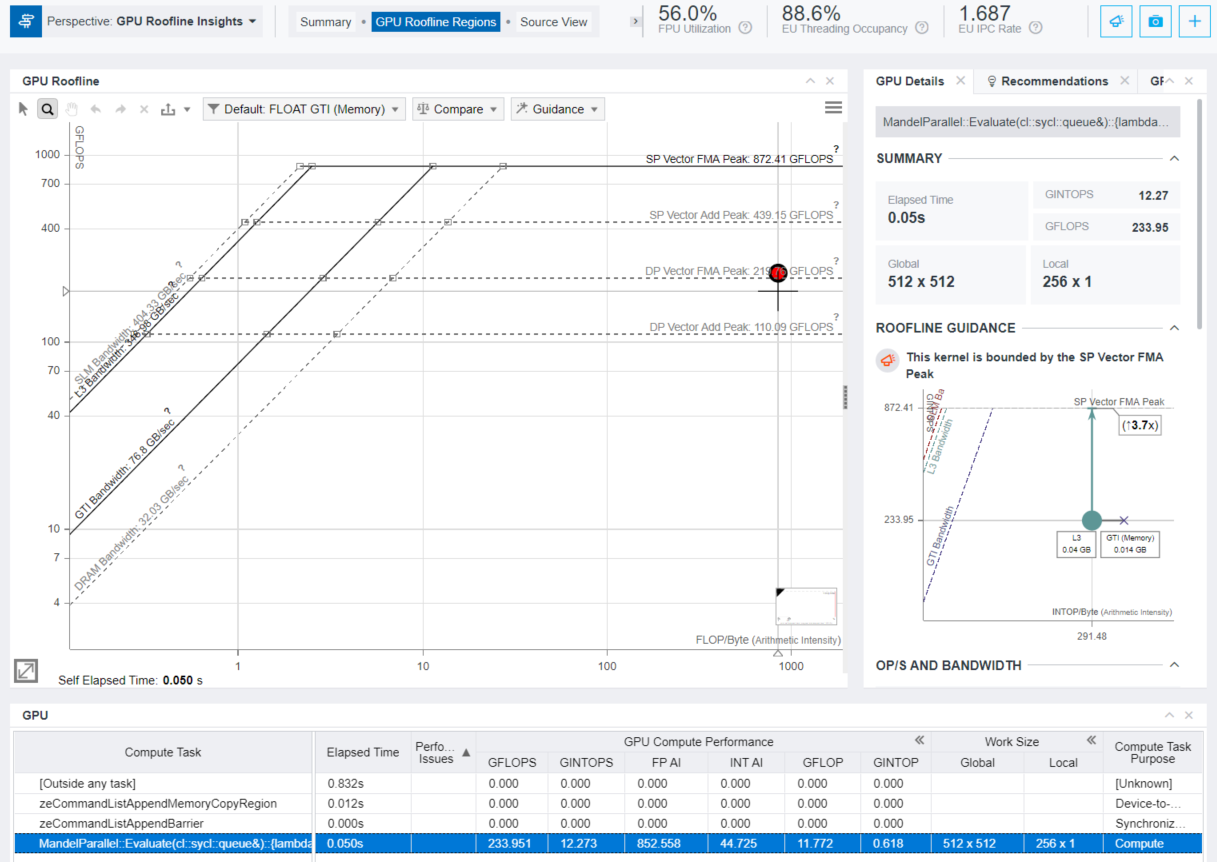
To get a more detailed per-kernel view, click the compute task of interest in the Top Hotspots pane or click the GPU Roofline Regions tab. This tab contains the GPU Roofline chart on the left side and a detailed overview of a selected kernel with its GPU Source and Assembly views on the right side. In the bottom of GPU Roofline Regions tab, there is a GPU pane containing a grid view with the list of the kernels and related raw collected data (including memory-related data, EU active/stalled/idle data, EU thread occupancy, number of threads). For more information, see Examine Bottlenecks on GPU Roofline Chart.
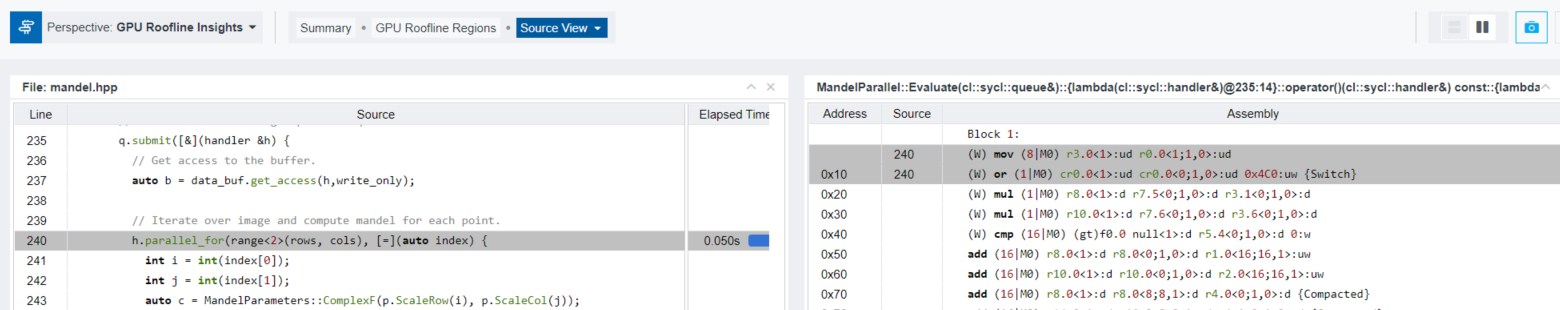
Right-click the compute task of interest in the GPU table and select View Source or click the Source View tab. It shows the matching of sources with assembly code.
Explore Detailed GPU Metrics with Intel Advisor Python* API
To visualize the already collected GPU Roofline results in CLI, use Python scripts from /opt/intel/oneapi/advisor/latest/pythonapi/examples. The scripts use Intel Advisor Python API to print raw metrics that may be post processed via user custom scripts. Refer to the examples below.
Print GPU Roof Values
Run the gpu_roofs.py script sample to check the values of GPU roofs measured during GPU Roofline collection.
advisor-python /opt/intel/oneapi/advisor/latest/pythonapi/examples/gpu_roofs.py ./adv_gpu_rooflineA list of GPU roofs is printed to the terminal similar to the following:
DP Vector FMA Peak 219 GFLOPS
DP Vector Add Peak 110 GFLOPS
SP Vector FMA Peak 872 GFLOPS
SP Vector Add Peak 439 GFLOPS
Int64 Vector Add Peak 110 GFLOPS
Int32 Vector Add Peak 438 GFLOPS
Int16 Vector Add Peak 873 GFLOPS
Int8 Vector Add Peak 432 GFLOPS
SLM Bandwidth 404 GB/s
L3 Bandwidth 346 GB/s
DRAM Bandwidth 32 GB/s
GTI Bandwidth 76 GB/s
View Detailed Per-Kernel Metrics
Run the survey_gpu.py script sample to view the detailed list of metrics for each kernel from the pre-collected GPU profile, such as detailed kernel instruction mix.
advisor-python /opt/intel/oneapi/advisor/latest/pythonapi/examples/survey_gpu.py ./adv_gpu_rooflineA list of GPU metrics is printed to the terminal similar to the following:
============================================================
Main GPU Dataset
============================================================
…
============================================================
…
carm_l3_cache_line_utilization_______________: 1
carm_slm_cache_line_utilization______________: 0
carm_traffic_gb______________________________: 0.105906
computing_task_______________________________: MandelParallel::Evaluate(cl::sycl::queue&)::{lambda(cl::sycl::handler&)@235:14}::operator()(cl::sycl::handler&) const::{lambda()@240:44}
computing_task_average_time__________________: 0.000498183
…
elapsed_time_________________________________: 0.0503165
…
gpu_compute_performance_fp_ai________________: 852.558
gpu_compute_performance_gflop________________: 11.7716
gpu_compute_performance_gflops_______________: 233.951
gpu_compute_performance_gintop_______________: 0.617538
gpu_compute_performance_gintops______________: 12.2731
gpu_compute_performance_gmixop_______________: 12.3891
gpu_compute_performance_gmixops______________: 246.224
gpu_compute_performance_int_ai_______________: 44.7253
gpu_compute_performance_mix_ai_______________: 897.283
gpu_memory_bandwidth_gb_sec__________________: 0.27441
gpu_memory_bandwidth_gb_sec_read_____________: 0.233971
gpu_memory_bandwidth_gb_sec_write____________: 0.0404391
gpu_memory_data_transferred_gb_______________: 0.0138074
gpu_memory_data_transferred_gb_read__________: 0.0117726
gpu_memory_data_transferred_gb_write_________: 0.00203475
…
work_size_global_____________________________: 512 x 512
work_size_local______________________________: 256 x 1
============================================================
Instruction Mix Dataset
============================================================
zeCommandListAppendMemoryCopyRegion: 0
============================================================
zeCommandListAppendBarrier: 2
============================================================
MandelParallel::Evaluate(cl::sycl::queue&)::{lambda(cl::sycl::handler&)@235:14}::operator()(cl::sycl::handler&) const::{lambda()@240:44}: 1
    Type: Size: Op Type   : Callcount          : Exec Count         : Dynamic Count
    INT : 32  : MOVE      : 104,403,397        : 1,488,428,112      : 1,351,879,647
    INT : 32  : BIT       : 3,309,568          : 28,131,328         : 28,131,328
    INT : 32  : BASIC     : 190,604,170        : 509,977,482        : 509,977,482
        :     : OTHER     : 165,063,391        : 2,641,014,256      : 2,505,733,341
        :     : CONTROL   : 335,418,273        : 4,110,086,021      : 2,400,317,722
    FP  : 32  : MOVE      : 13,238,272         : 112,525,312        : 112,525,312
    FP  : 32  : MATH      : 3,309,568          : 3,309,568          : 3,309,568
    FP  : 32  : BASIC     : 165,999,156        : 2,655,986,496      : 2,385,424,666
    FP  : 32  : FMA       : 327,033,960        : 5,232,543,360      : 4,691,419,700
    INT : 64  : BASIC     : 3,309,568          : 26,476,544         : 26,476,544
    INT : 32  : FMA       : 3,309,568          : 26,476,544         : 26,476,544
    INT : 16  : STORE     : 1,654,784          : 26,476,544         : 26,476,544
============================================================
Alternative Steps
Run GPU Roofline Insights Perspective on a Multi-GPU Systems (Instead of Default Configuration)
If your system has more than one GPU device (for example, an integrated GPU and a discrete GPU, or several discrete GPU devices), specify a target GPU to collect profiling data:
- Get the list of GPU devices available on your system:
advisor --help target-gpuThe output shows the device configuration in the following format: <domain>:<bus>:<device-number>.<function-number>.
- Copy the device configuration that you want to analyze. For example, 0:0:2.0 .
- Type the following command to the terminal with the --target-gpu option and provide the copied device configuration as its argument to select the GPU of interest:
advisor --collect=roofline --profile-gpu --target-gpu=0:0:2.0 --project-dir=./adv_gpu_roofline -- ./src/mandelbrot - Run the command.
Run GPU Roofline Insights Perspective for Kernels with Small Execution Time (Instead of Default Configuration)
Accuracy decreases with decreasing the ratio of kernel time to sampling interval. To achieve the best accuracy, ensure that 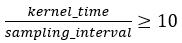
To avoid inaccurate metrics for kernels with small execution time, use --gpu-sampling-interval=<double> option to decrease the interval (in milliseconds) between GPU samples:
advisor --collect=roofline --profile-gpu --gpu-sampling-interval=0.1 --project-dir=./adv_gpu_roofline -- ./src/mandelbrot